Simplifying Reporting for Efficiency
The position of an L&D manager is notably demanding, encompassing a range of important responsibilities. These include crafting an organisation’s training and development strategy, ensuring adherence to compliance and regulatory mandates, and continuously evaluating the impact of training programs. Given the multitude of tasks and the constraints of time and resources, using efficient tools becomes paramount.
Certain information has been omitted or obfuscated in this case study. The opinions presented here represent my views alone, not of my current or past employers.
The Role
During my initial year and a half at Go1, my primary focus was enhancing the L&D Manager experience on the Go1 learning platform. In my role as a Senior Product Designer, I actively engaged with customers to understand their needs, how they work daily and their pain points.
Customer Research
I conducted interviews with a number of L&D Managers to better understand their needs and pain points, which eventually led to valuable insights.
Opportunity Solution Tree Mapping
After conducting customer research, I mapped out an Opportunity Solution Tree to ensure the opportunities tied back to our goal.
Wireframing
The initial ideas around reporting were expressed in wireframes. These we tested internally with our L&D and Customer Success teams.
UI Design
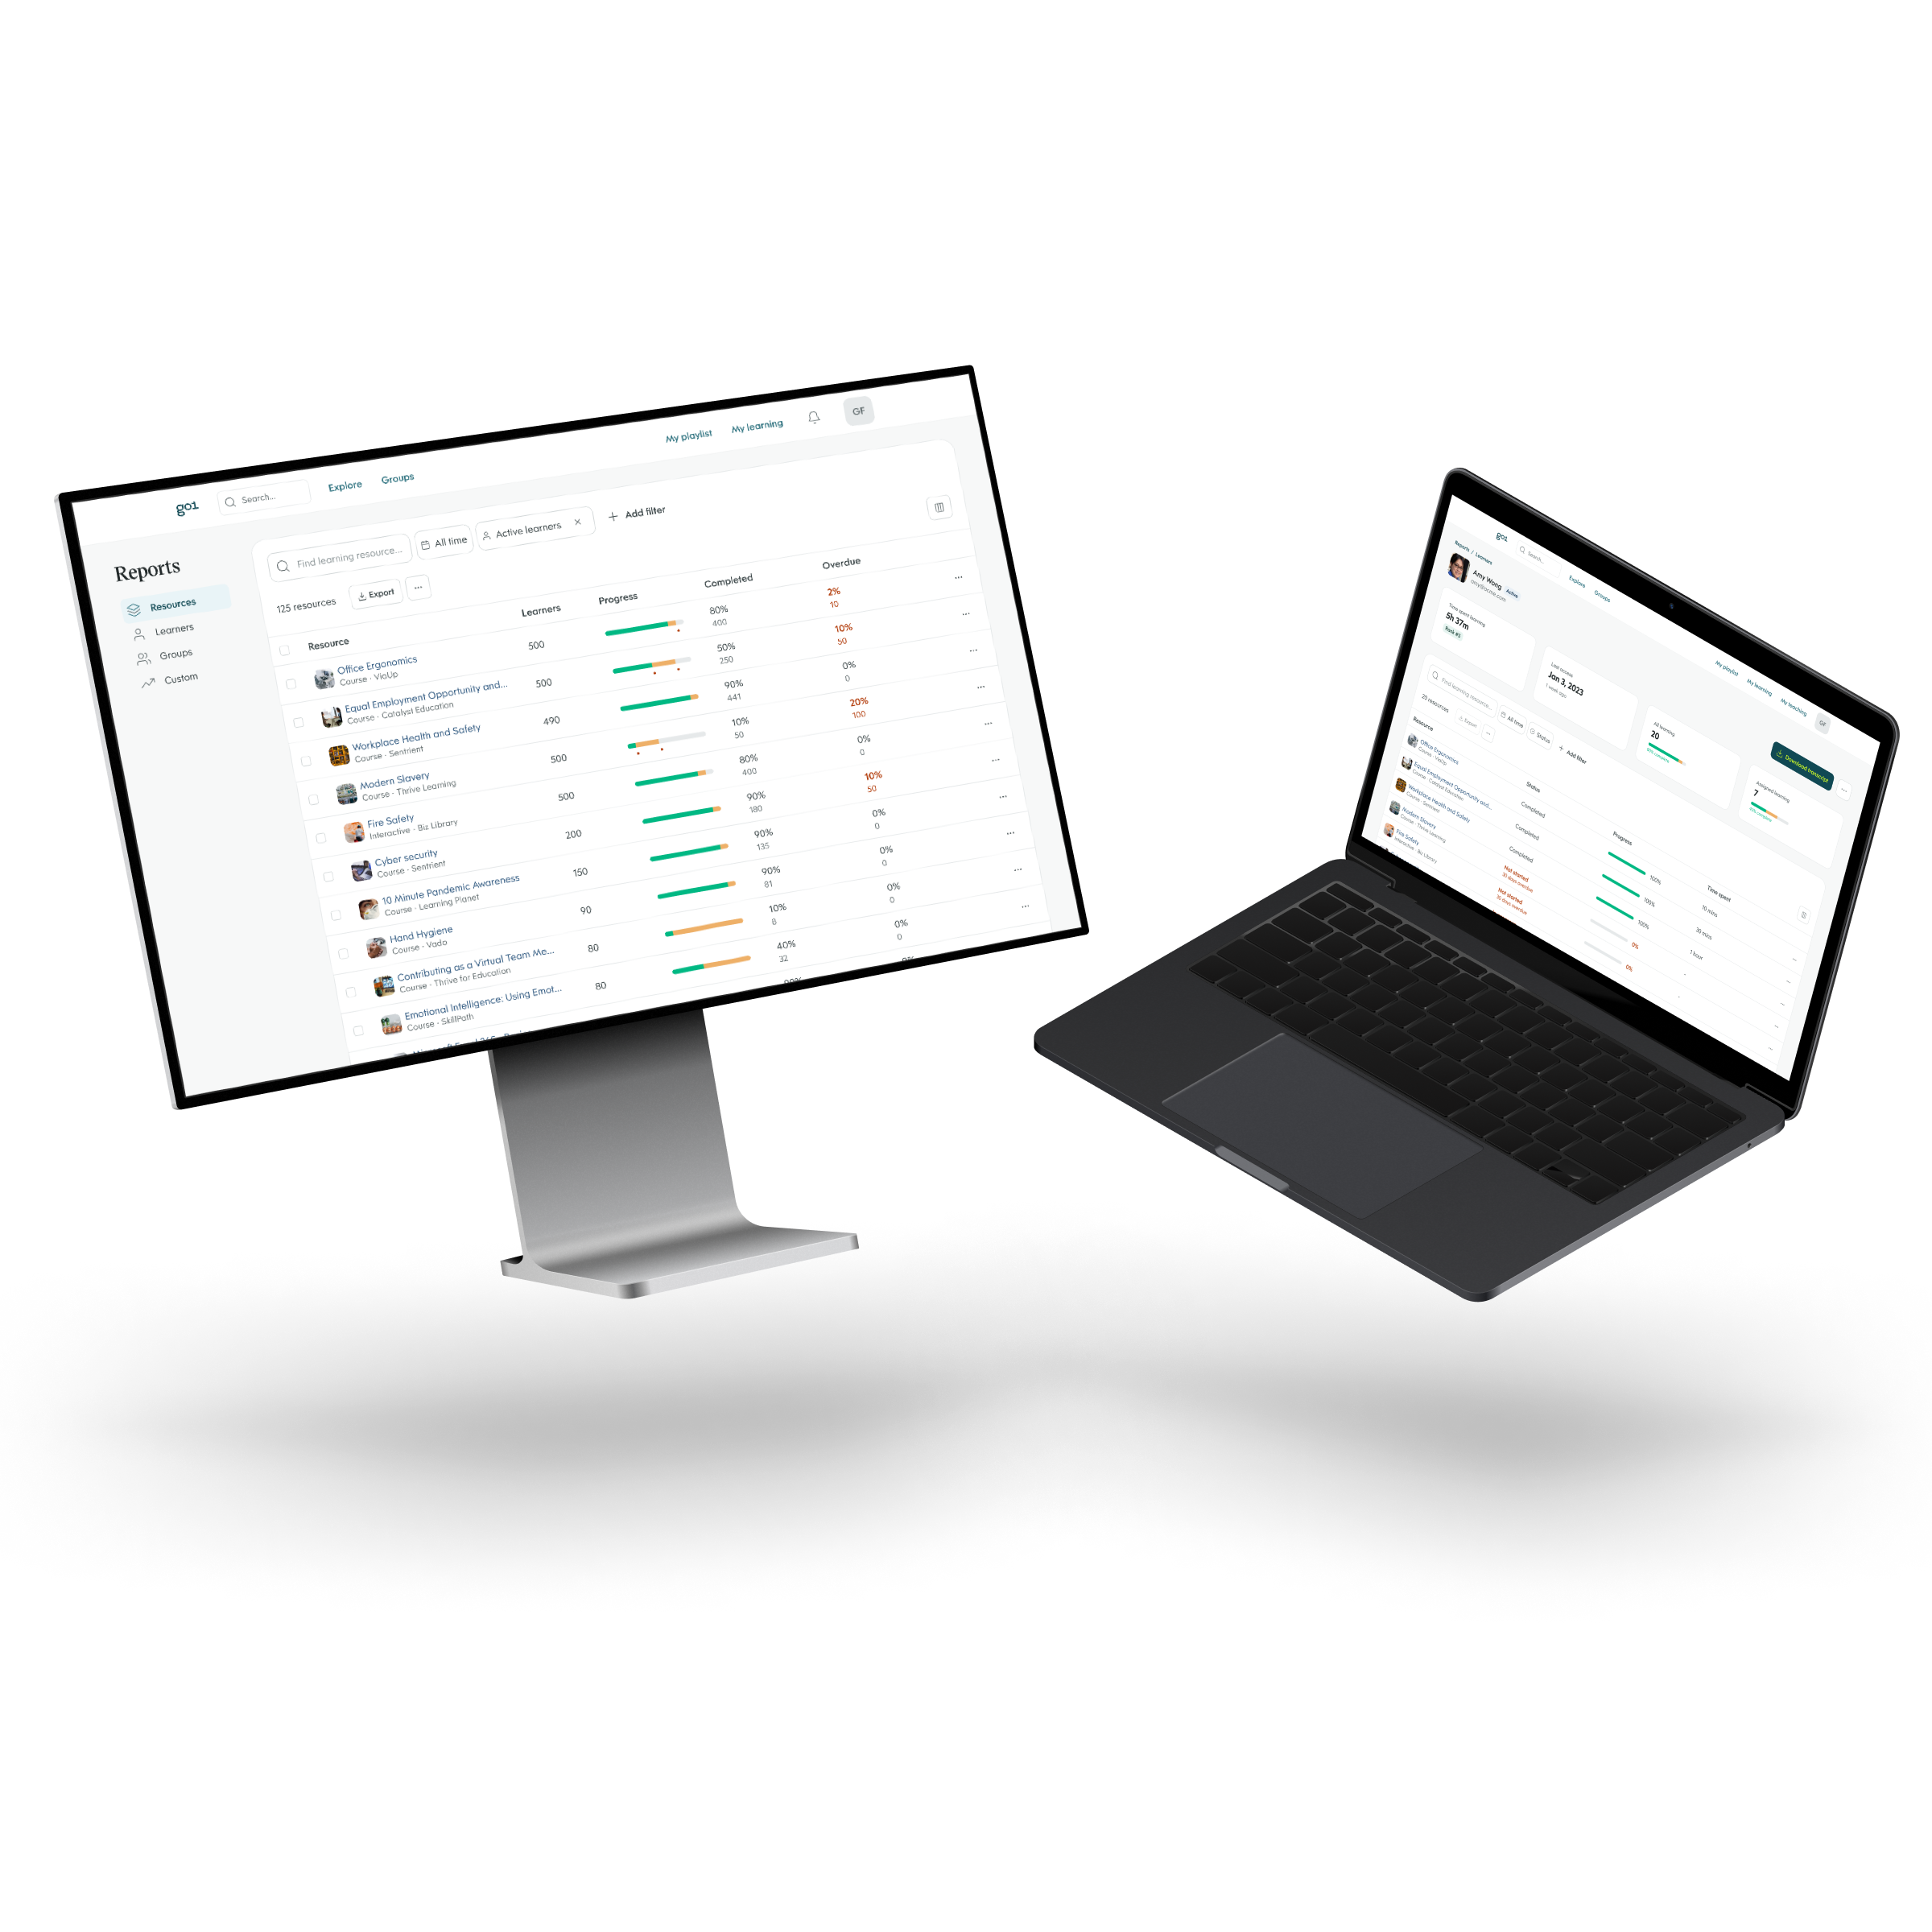
I redesigned the reporting section and contributed new components and patterns to our Go1d Design System.
Prototyping
I created a set of click prototypes in Figma. Care was taken to ensure realistic data was used on all screens as small mistakes tend to throw off expert participants.
Usability Testing
Usability testing was conducted to ensure a high level of usability and to obtain additional evidence that the solution was indeed sound.
Discovery
The reporting functionality within the Go1 learning platform has long been a source of difficulty for our customers. Although it boasts some powerful capabilities by mimicking the functionality of a database, it was designed without adequately considering the level of technical expertise of its primary user, L&D managers. Unsurprisingly, reporting consistently ranked within the top five customer frustrations in our quarterly customer satisfaction surveys.
From a business perspective, the reporting toolkit was proving costly. Approximately 2000 support hours were spent annually dealing with reporting queries. That is the equivalent of one full-time staff member. In addition, the reporting suite was built on legacy technology, which meant the engineering team was struggling with maintenance and the most simplest updates.
Customer Interviews
To learn more about the customer pain points and reporting in general, we spoke to L&D managers from a diverse set of organisations. These ranged from medium to enterprise sized organisations (500 to 5000 employees), all from different industries such as education, retail, logistics, insurance, engineering, law, agriculture, and healthcare.
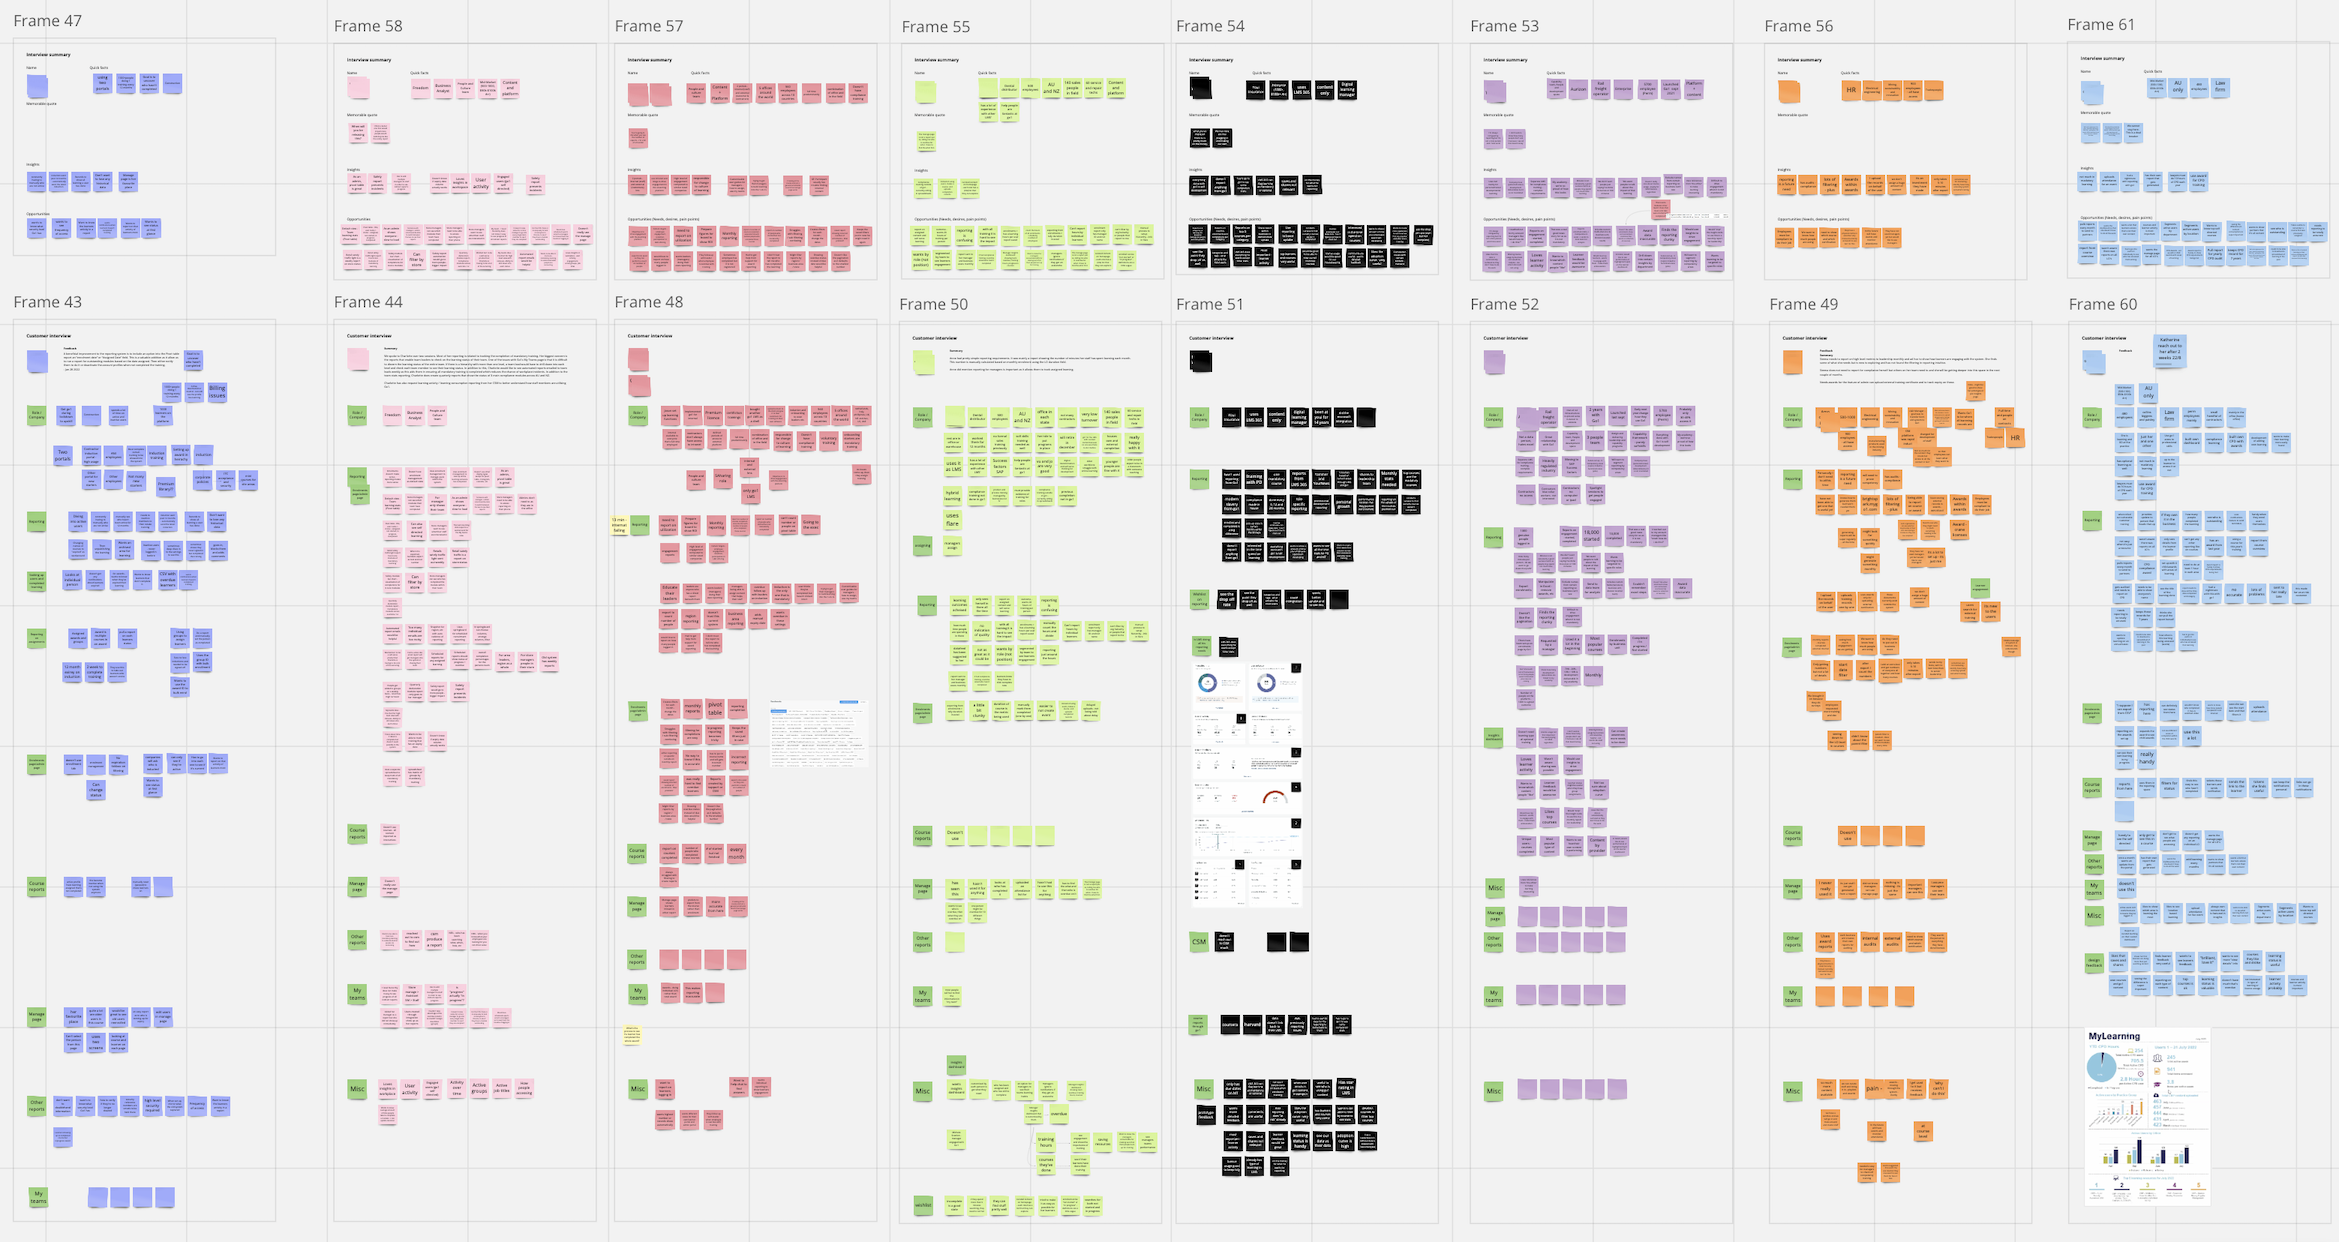
During the interviews, we delved into the various learning activities carried out within their organisations and their methods for reporting on them. We encouraged participants to demonstrate how they set up their reports and share what they were doing with them. Each participant’s needs, wants and pain points we recorded and summarised after each session. After all the interviews were conducted, we synthesised our findings and translated them into an opportunity solution tree. This allowed us to better visualise the opportunities while making sure they were aligned with our goals.
Key insights
The most important insight I took away from the research was the various types of reporting conducted to support the different jobs of an L&D manager. As seen at the top of the opportunity solution tree, the main reasons for conducting reporting are to ensure mandatory training is being completed, understand the engagement with upskilling content and demonstrate a return on the investment in learning.
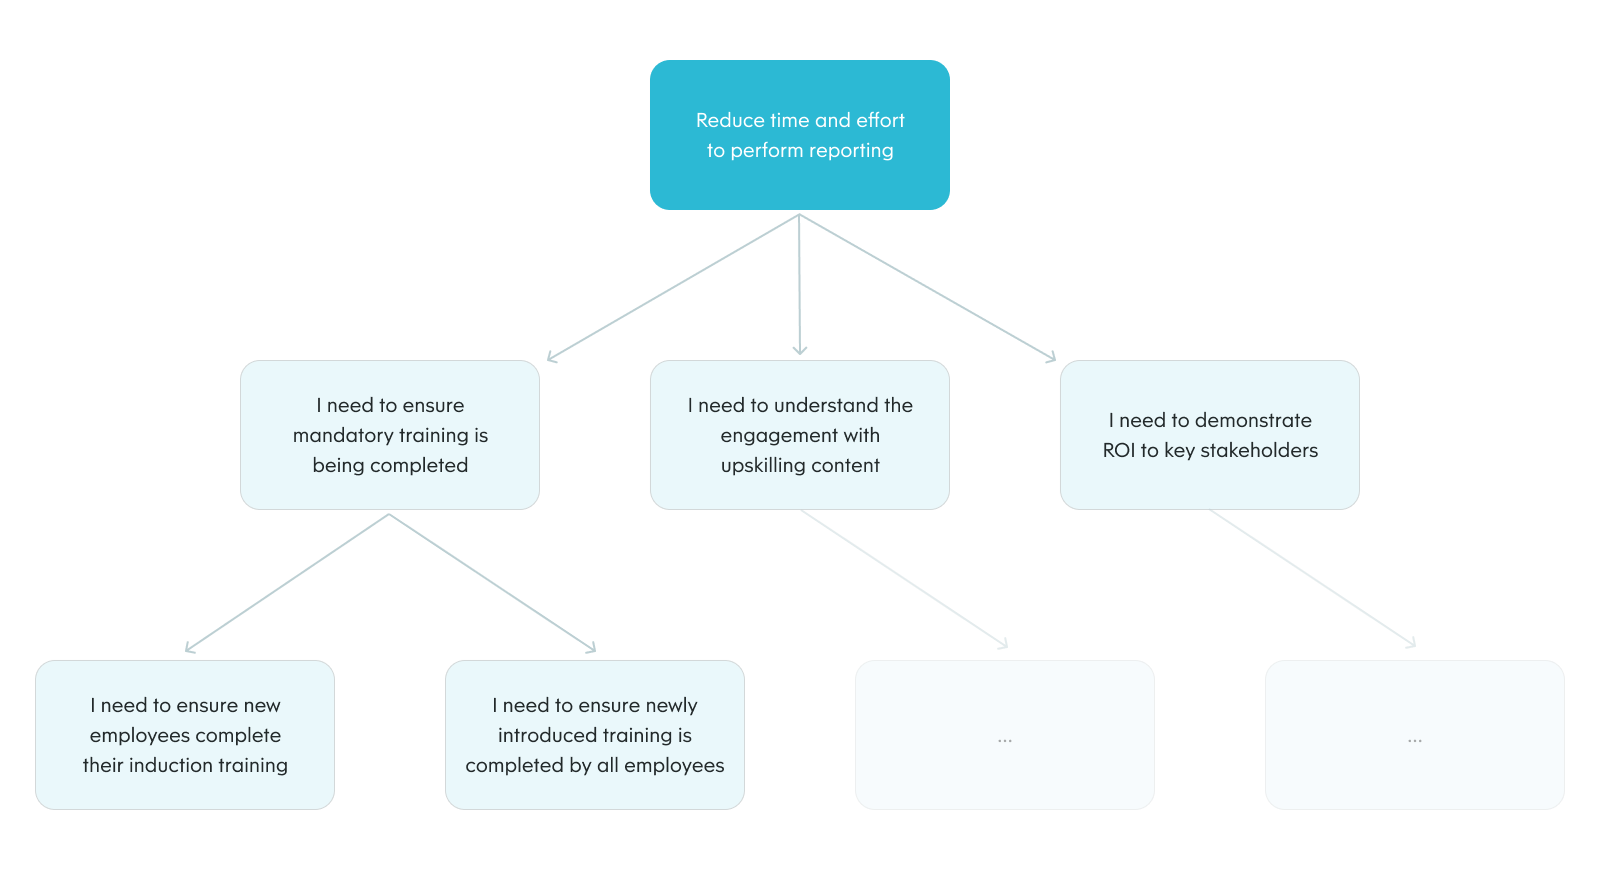
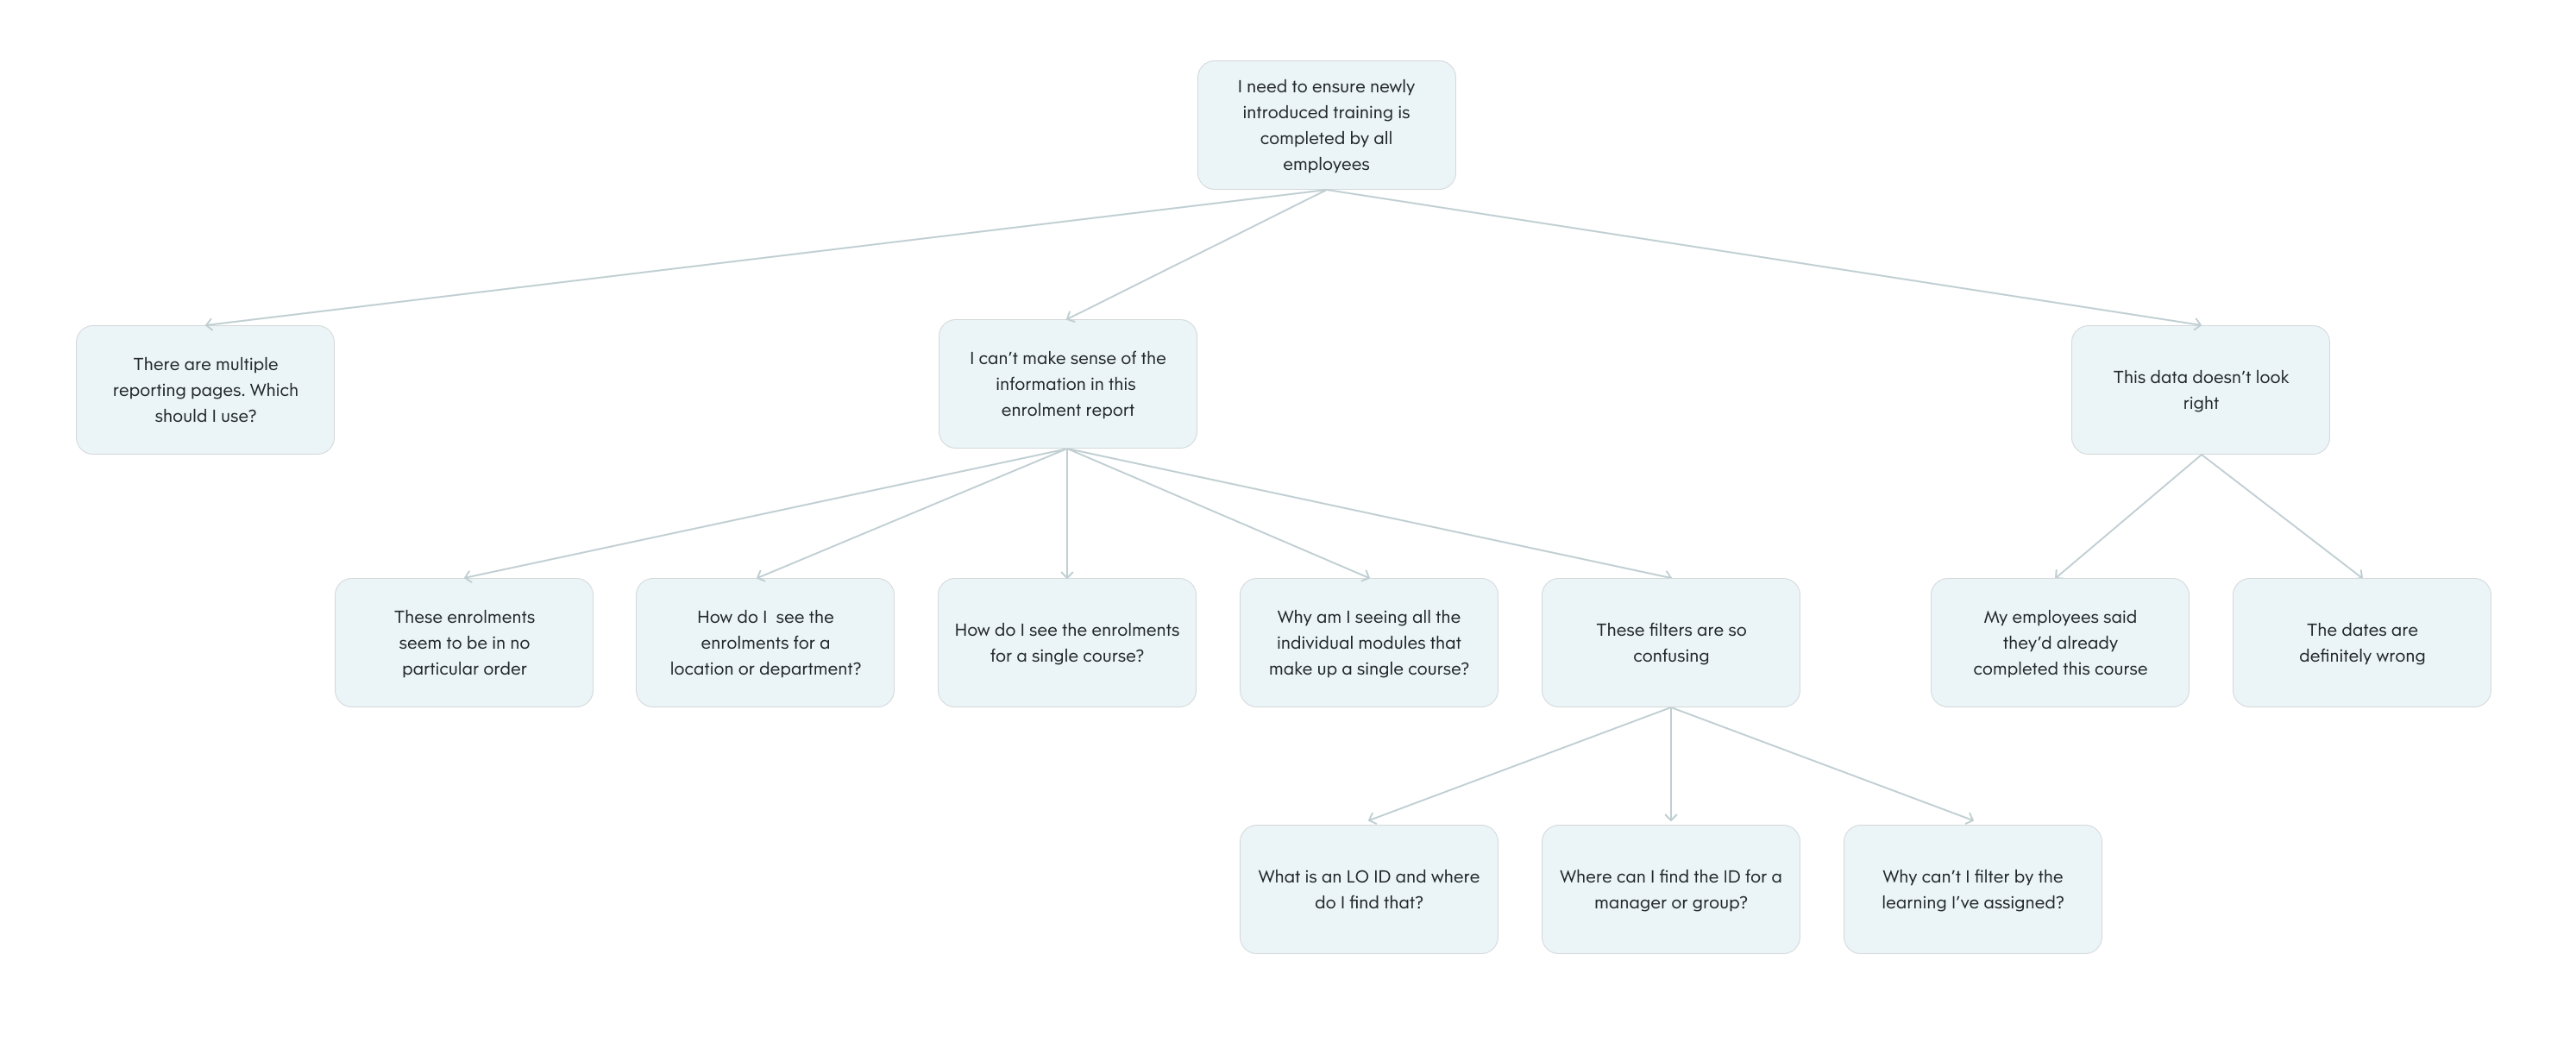
Due to the size and complexity of this initiative, we chose to narrow our focus on one of the three branches of the opportunity solution tree. We decided we would first work on making it easier for L&D managers to report on mandatory training as this was the most common requirement for the businesses we deal with. Some of the high-level opportunities that cropped up in relation to this were, not knowing where to go to perform reporting, not being able to make sense of the enrolment data and not being able to trust data they were seeing. The following portion of the opportunity solution touches on the details.
Solution exploration
Wireframes
As with any initiative, we started ideating with wireframes as this allowed us to explore multiple options in the shortest amount of time. Most of the concepts centred around the use of hierarchy to help users make sense of the information. This also allowed us to give the user an aggregate view of learning resources, learners and groups.
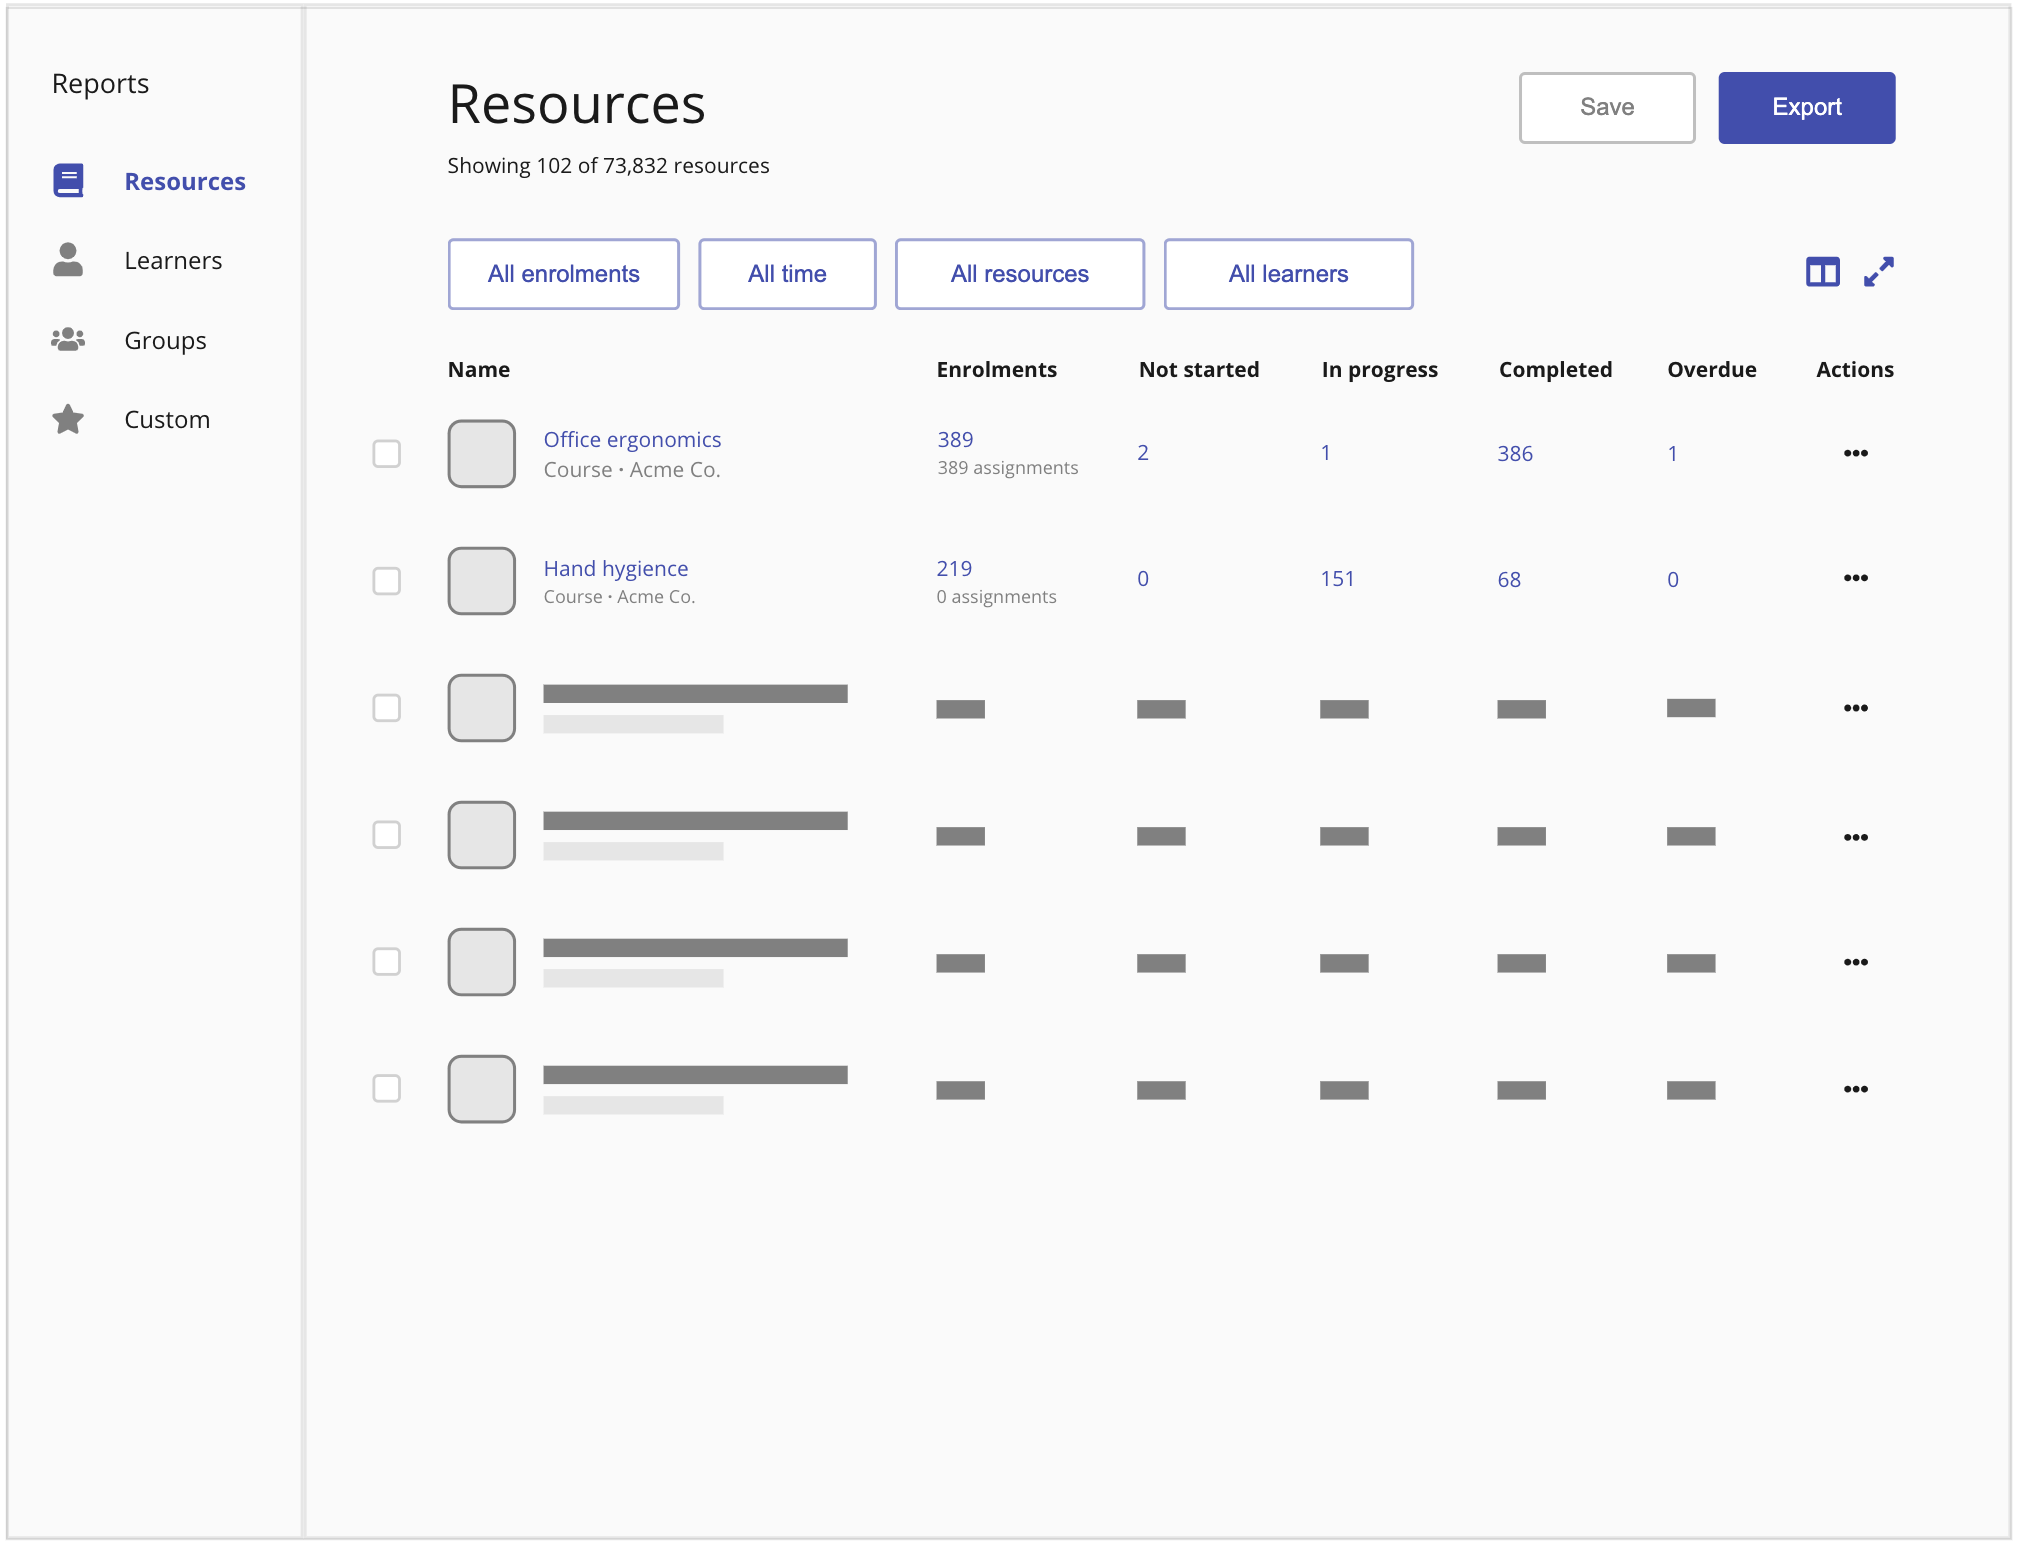
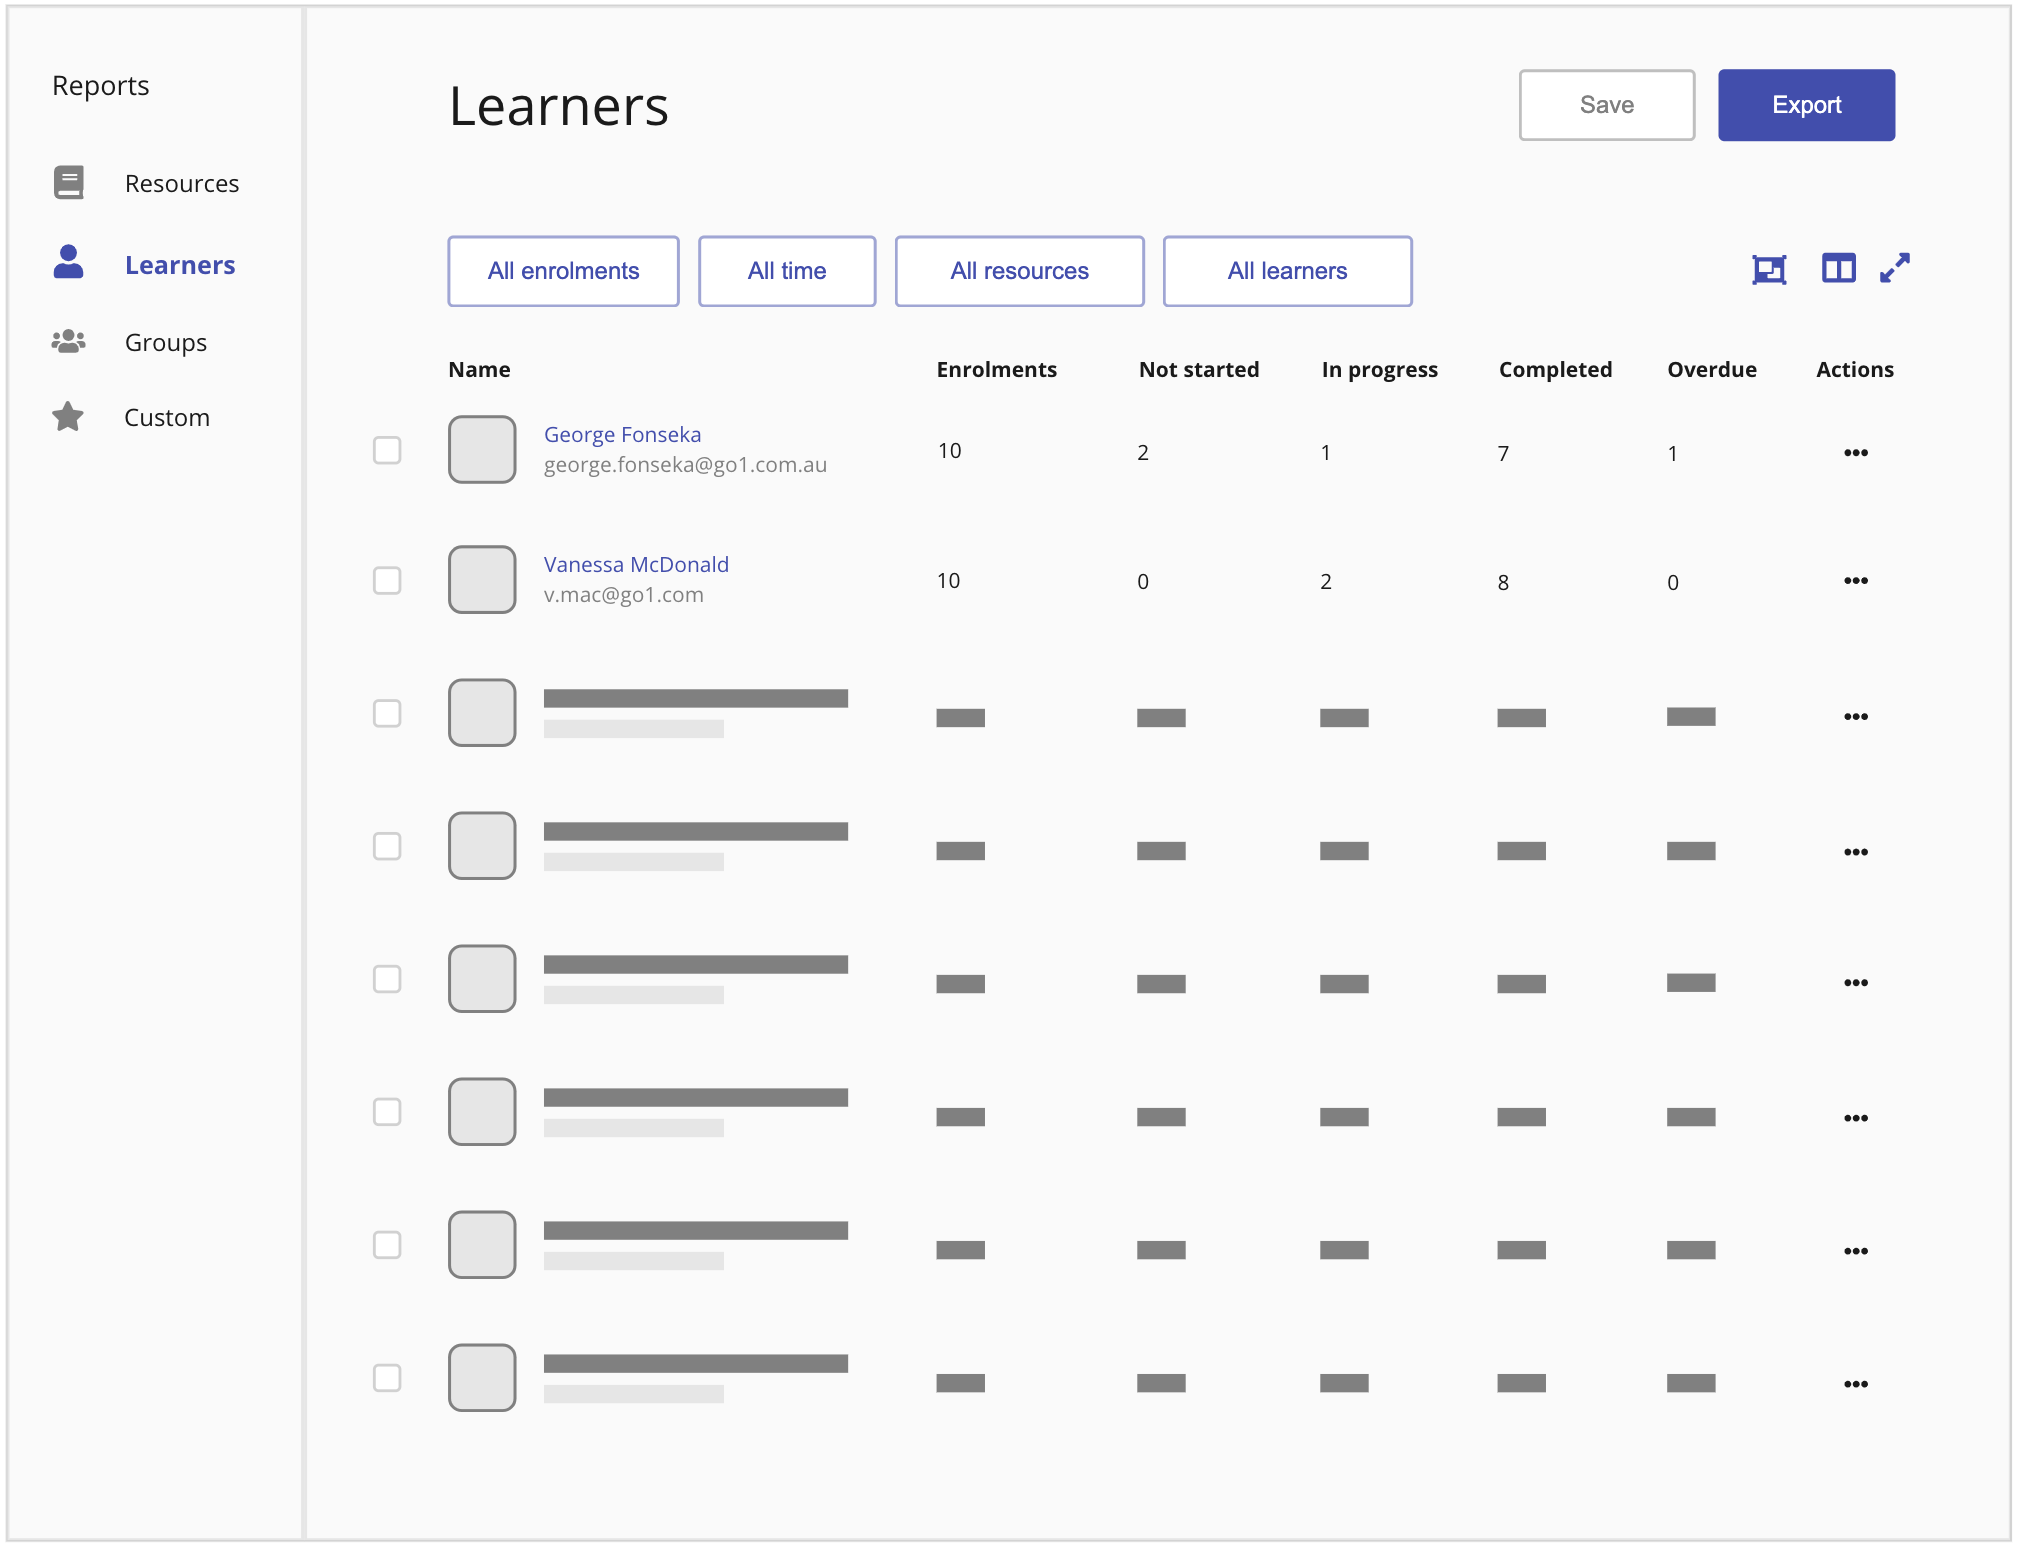
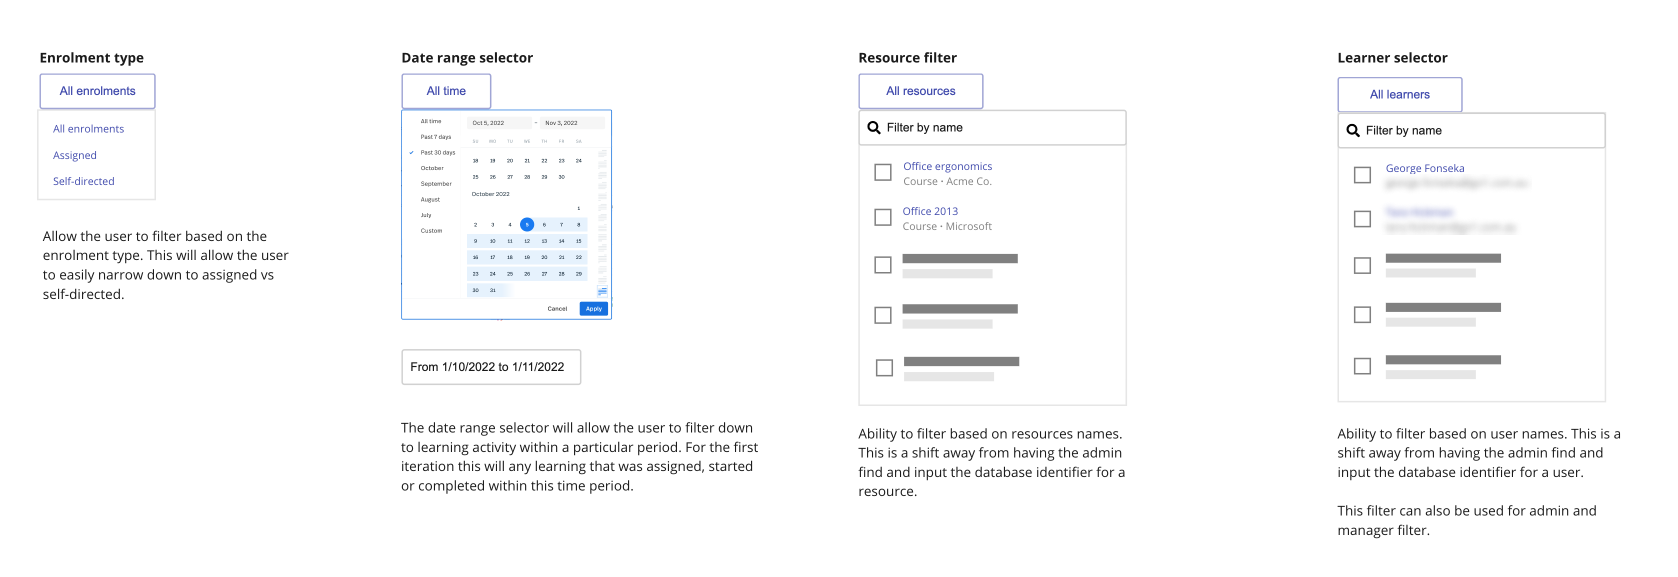
Apart from this, we had to make filtering more intuitive. The new filters needed to steer clear from using database identifiers or any complex parent-child relationships like what is available in the current product. In addition, we had to include the ability to segment the learning based on whether it was assigned or if it was self-directed learning as this is a fundamental way L&D teams track the progress of their learning.
To ensure our ideas had merit, we conducted a round of concept testing with our internal L&D team and customer success managers. This gave us the confidence we needed to progress towards high-fidelity designs.
Hi-fi designs & prototyping
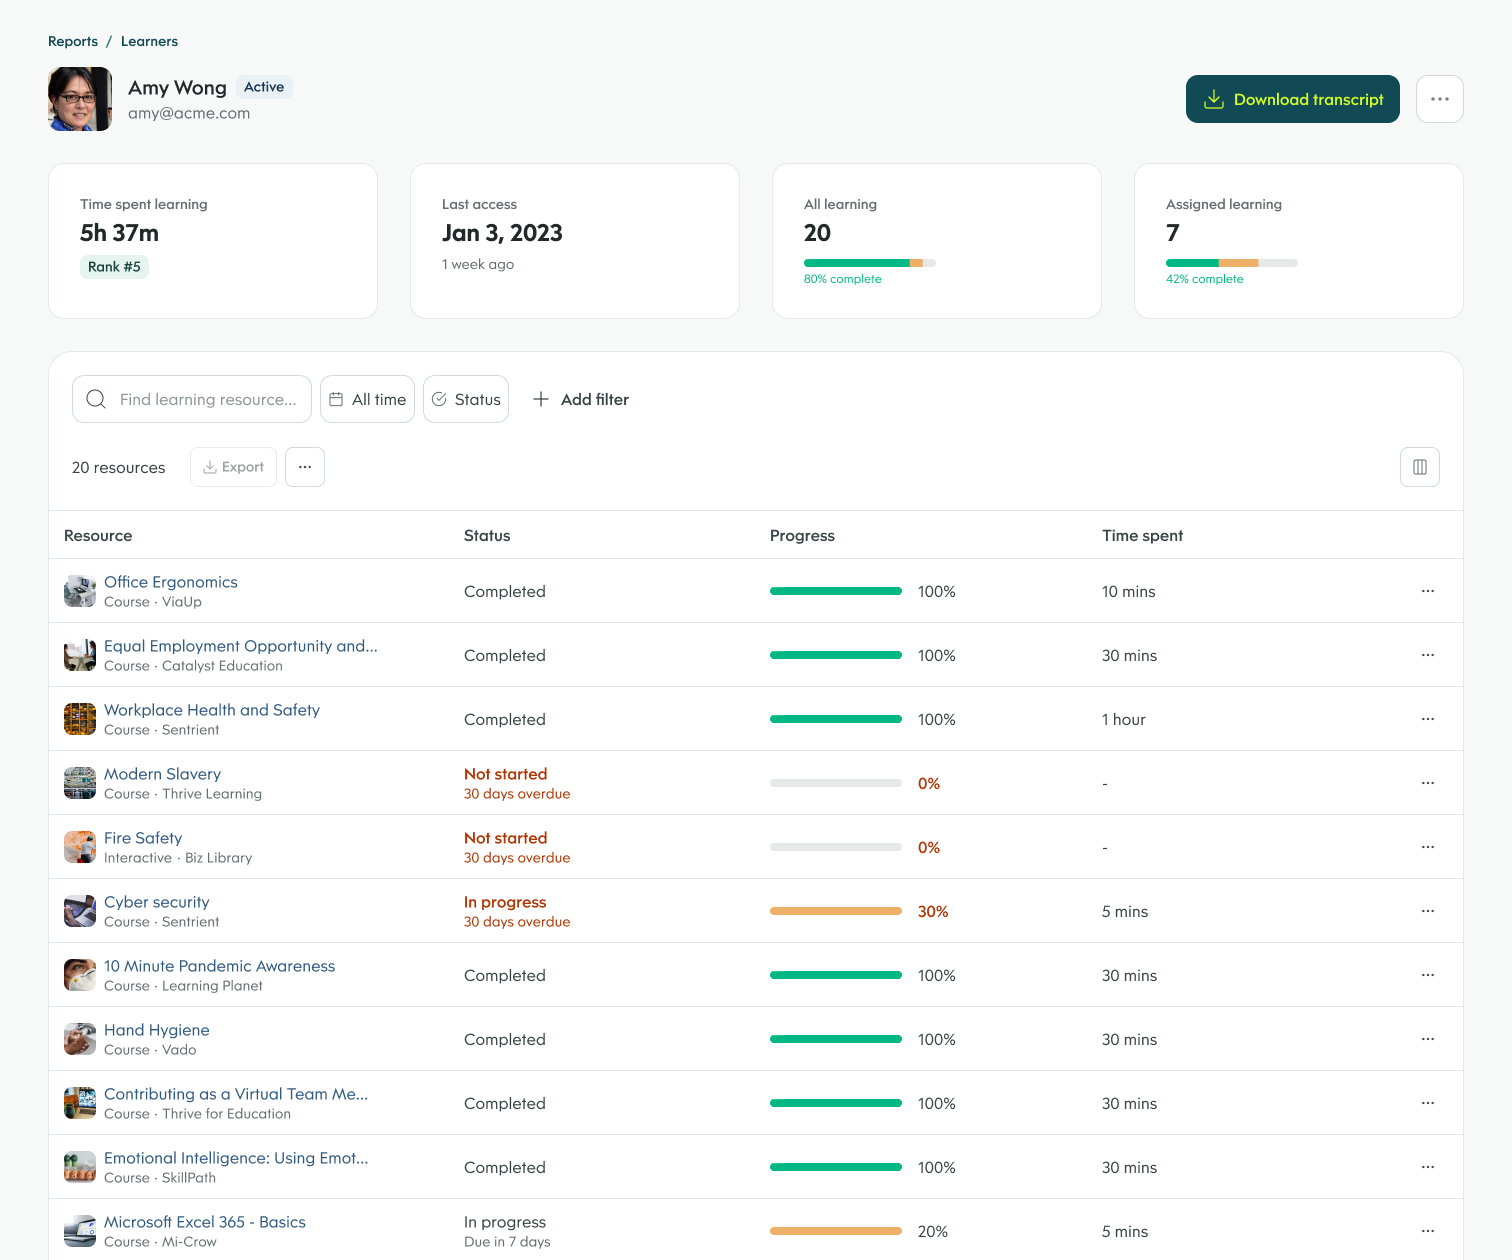
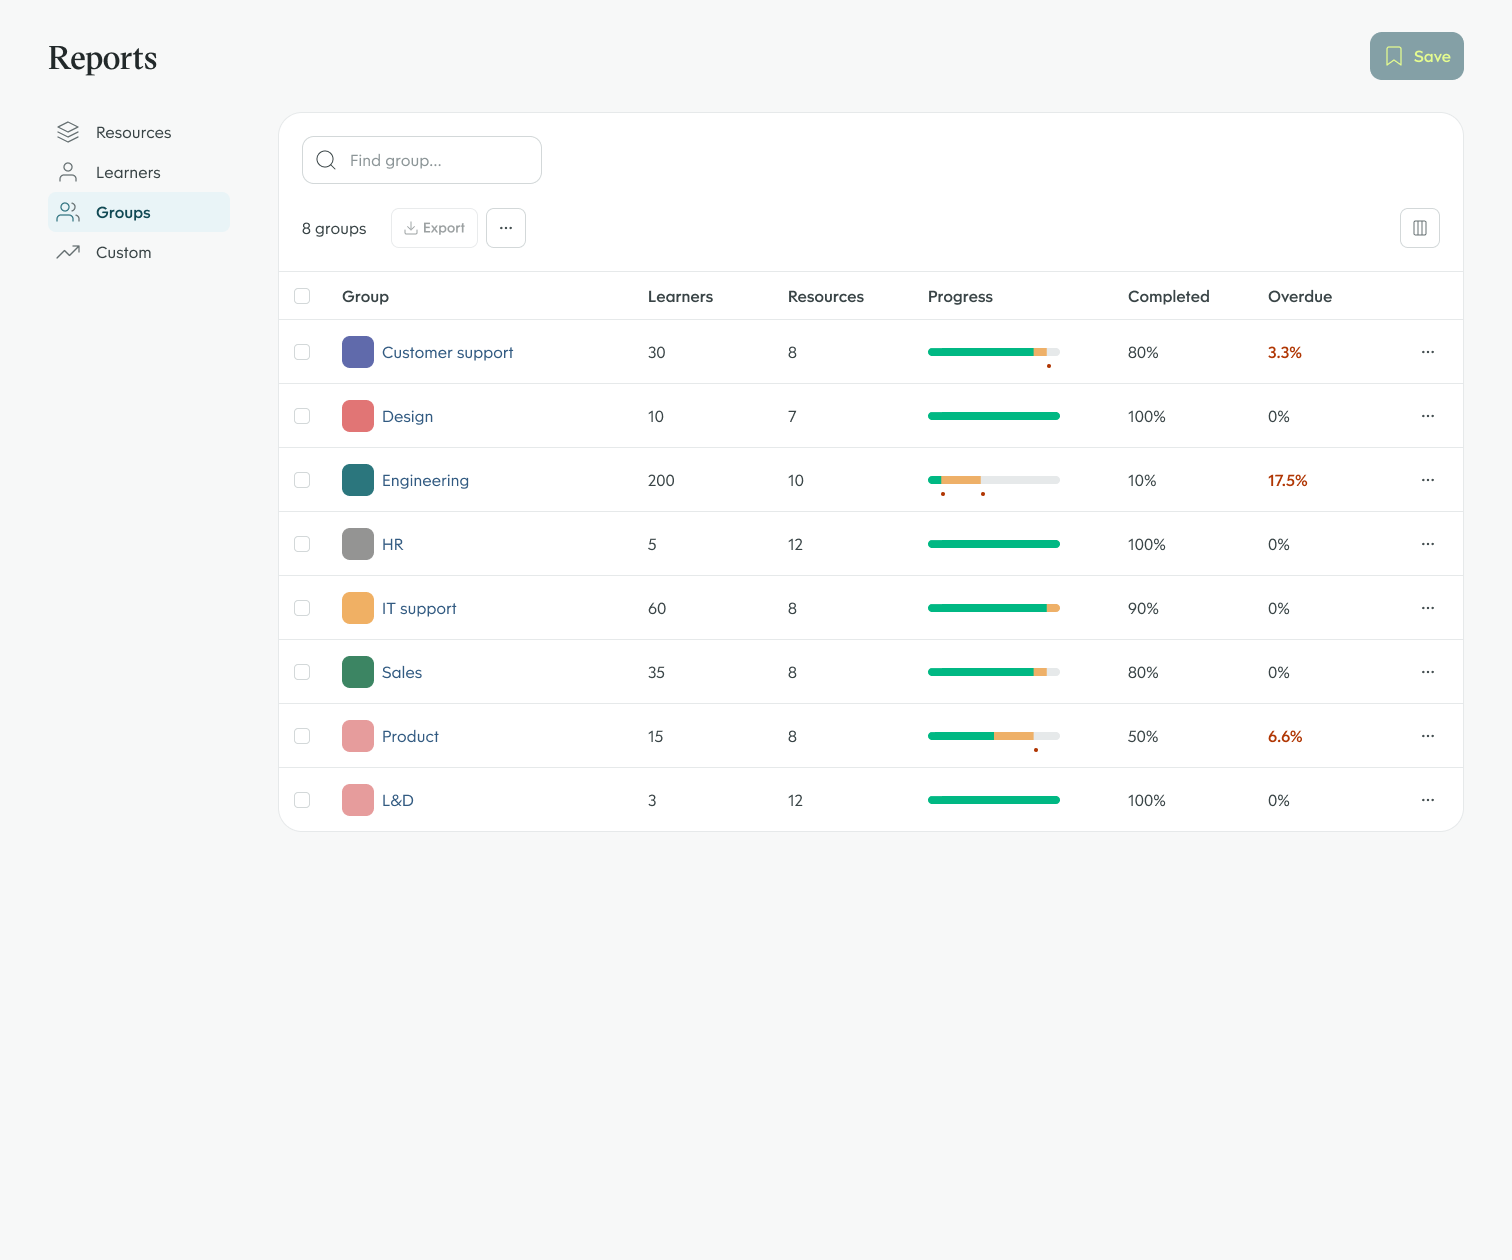
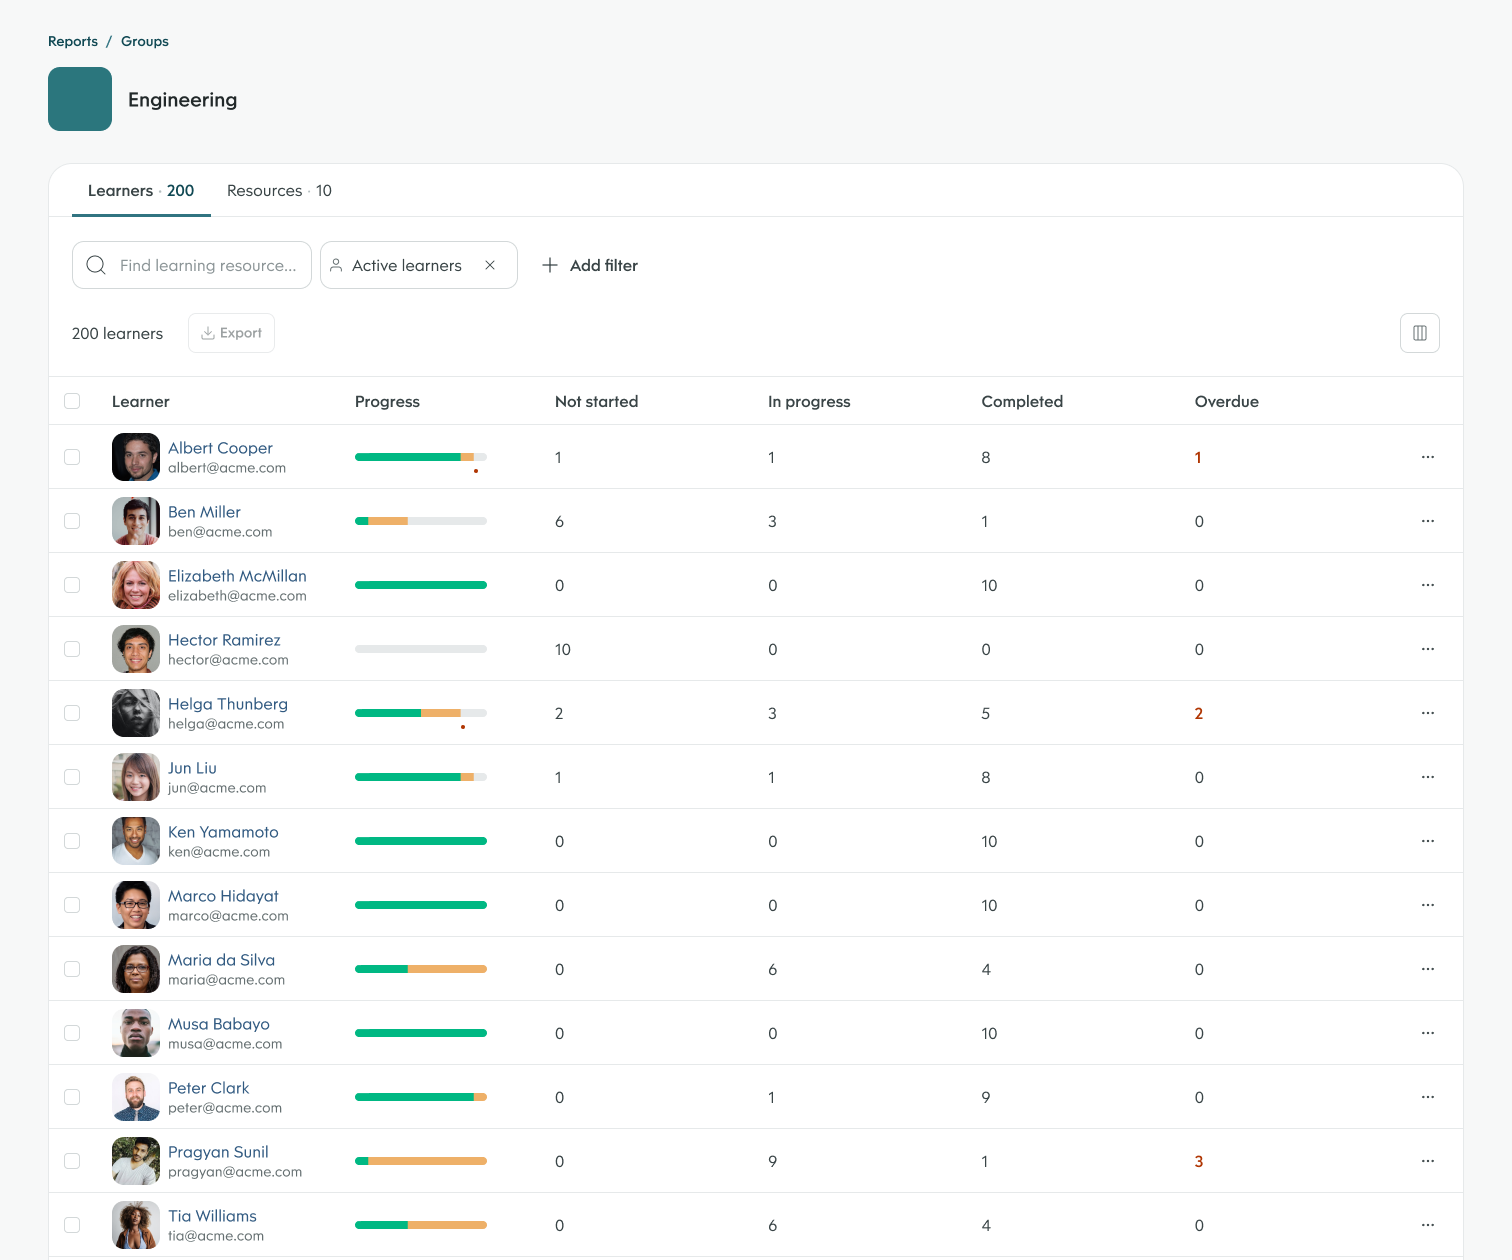
Progressing towards high-fidelity designs was a relatively straightforward task. Apart from the small data visualisations, most of the components already existed in the Go1d Design System. The most time-consuming aspect of the work was ensuring the mock data appeared realistic enough for the prototype we would be using for usability testing.

Usability testing
We conducted a round of usability testing with 5 customers from organisations of varying sizes and industries. The purpose of the test was to ensure that the proposed designs were discoverable, intuitive and provided value to L&D managers.
One of the key focusses of the study was how participants interpreted the information in the Resources, Learners and Groups reports. With this, participants performed with flying colours. All participants were able to comprehend the high level aggregate information and managed to drill down further to find the details they needed.
Participant feedback
"I think this [resource report] is awesome. It's easy to consume no matter what role you play in the organisation."
– Participant 2
"I get tasked to check what new employees complete on the first and second day of employment so this [learner report] will be amazing."
– Participant 4
"The group report will help us work more effectively with how we've set up the platform."
– Participant 1
Overall participants responded favourably but of course, usability testing isn’t just about looking at the wins. Here a couple of insights that would be fed back into the designs or future initiatives.
- As a result of habit, a number of participants missed the new reporting section despite having a prominent “New” label on the navigation and an information banner on the old enrolments report.
- In addition to knowing when learners are overdue, it was expressed that L&D managers would want to know before a learner becomes due on any of their compliance training. This is because an organisation strives for a 100% compliance rate.
- Some of the filter names were quite ambiguous and would require more detail to avoid confusion.
- The ability to segment the data based on location and business unit is key in the way L&D teams function.
- On a similar note, a reporting view for managers / team leads would greatly reduce the work an L&D manager would have to do.
Post usability testing feedback
"I met with the team on Wednesday in which they ran through the prototype of the new reporting feature that will potentially be built on the platforms. Essentially this is exactly what our schools are desperate for. It's perfect! ... I thought I would reach out and see if there is anything you can do to throw some weight behind this to move it to the top of the list to be built."
– Participant 3
The cost of inaction
Unfortunately, an untimely change in product strategy led to a deprioritisation of this initiative. In the following half-year, customer churn numbers increased to a high not seen in years. “Reporting” was indeed cited as one of the top reasons for leaving, which led to a reversal in the prioritisation decision. The feature is scheduled to be built in the second half of FY23.