Go1 · 2024
Building Insights from Zero to One
TL;DR
Go1's learning platforms collected enormous amounts of learning data. L&D managers had no reliable way to make sense of it. As Lead Product Designer on the L&D Manager experience, I led design from early concept testing through to a live product, shipping iteratively across a Beta and four V2 milestones. In the first year, the product reached over 7,000 unique visitors and 15,000 sessions, with exploratory actions growing 85% as the feature set deepened.
Customer interviews · Concept testing · Data visualisation · UI design · Usability testing · Design system · Analytics · Iterative delivery
Certain information has been omitted or obfuscated in this case study. The opinions presented here represent my views alone, not of my current or past employers.

Go1's learning platforms collects enormous amounts of learning data but very few actionable insights were being surfaced out of the box. L&D managers had no reliable way to access or understand what skills their people were developing, whether their content was landing, or how their learning initiatives compared to others in their industry.
The problem had existed for a while, but it became a strategic priority in 2024. Go1's ICP had shifted toward enterprise customers in a $45B learning market, most running a different LMS to Go1's own. So insights needed to work as a value layer, not a platform feature. It was also a competitive lever: compliance content and library size alone no longer differentiated Go1 from LinkedIn Learning or Udemy Business. And it opened a partner-embed growth path, surfacing insights inside partner LMSs rather than just Go1's own interface.
Discovery
We spoke to seven L&D professionals across Finance, Healthcare, Hospitality, Automotive, Education, and IT, alongside Go1's Customer Success Managers who worked with these customers daily. Sessions were structured in two halves: a generative exploration of how they worked and what they measured, followed by an evaluative review of early concept designs.
The finding that reframed the project most was quite simple: good insights don't just help L&D managers demonstrate ROI after the fact. They help drive engagement that produces better ROI in the first place. Participants described feeling like they were “shooting in the dark.” Without reliable data, they couldn't improve programs, couldn't justify investment, and couldn't build the learning culture their organisations expected of them.
“You can't drive engagement without the right insights.”
Participant 2
Mapping the workflow
To find where Insights could have the most impact, we mapped the end-to-end L&D manager workflow from understanding an organisation's strategic objectives, through identifying skill gaps and sourcing content, to measuring outcomes and demonstrating impact to stakeholders. Against each step, we plotted what L&D managers were already doing, and how strong an opportunity existed for us to support it.
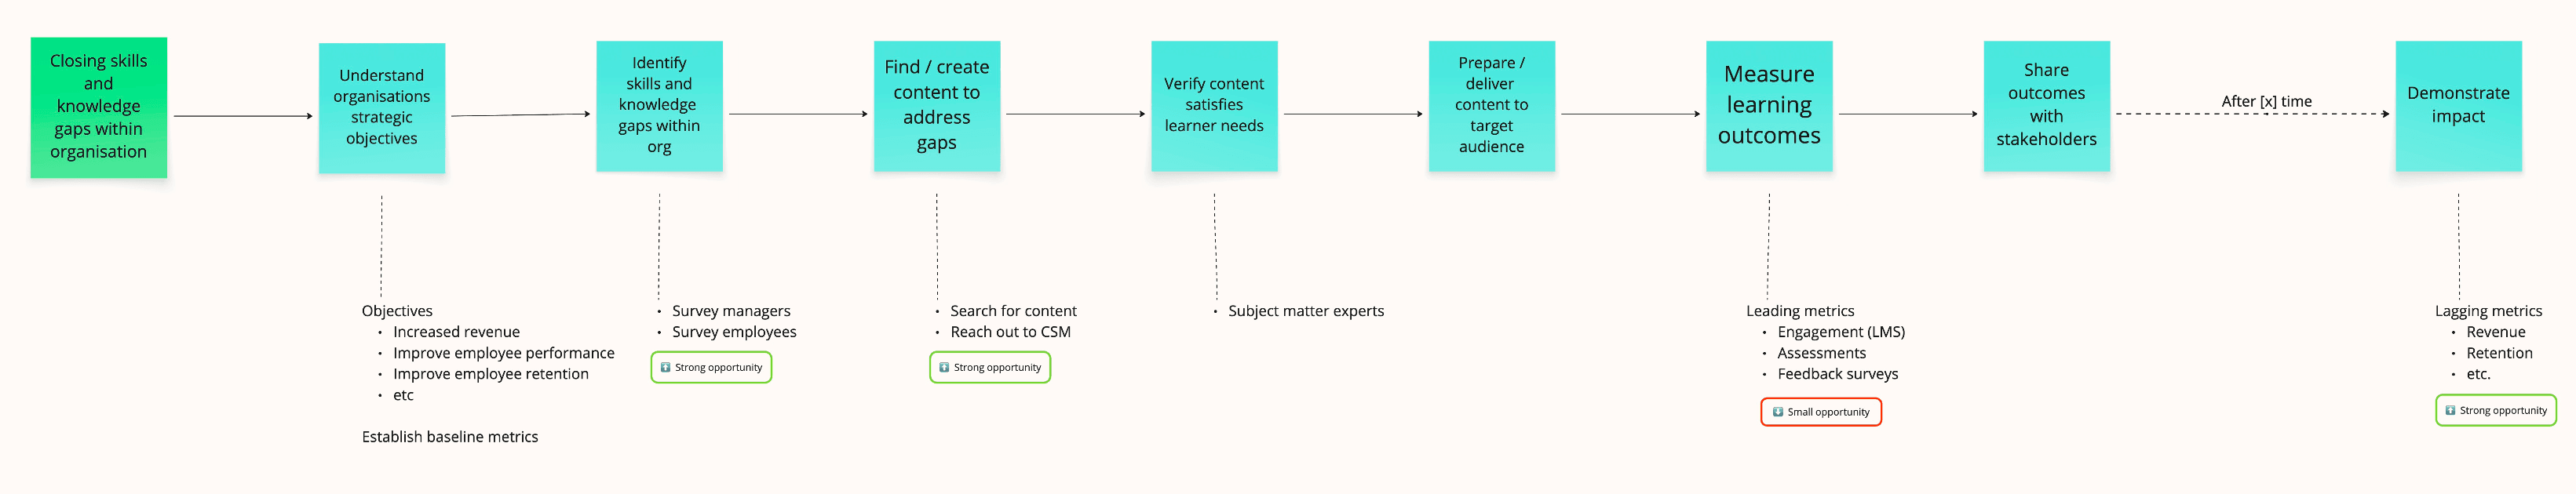
Two steps stood out as strong opportunities with comparatively little existing support: identifying skills and knowledge gaps, and finding content to close them. A third, demonstrating impact to stakeholders, was also a strong opportunity, but tangled up with talent and people metrics that sat outside our system. Measuring learning outcomes itself, by contrast, was already reasonably well served which made it a smaller opportunity for us to add to.
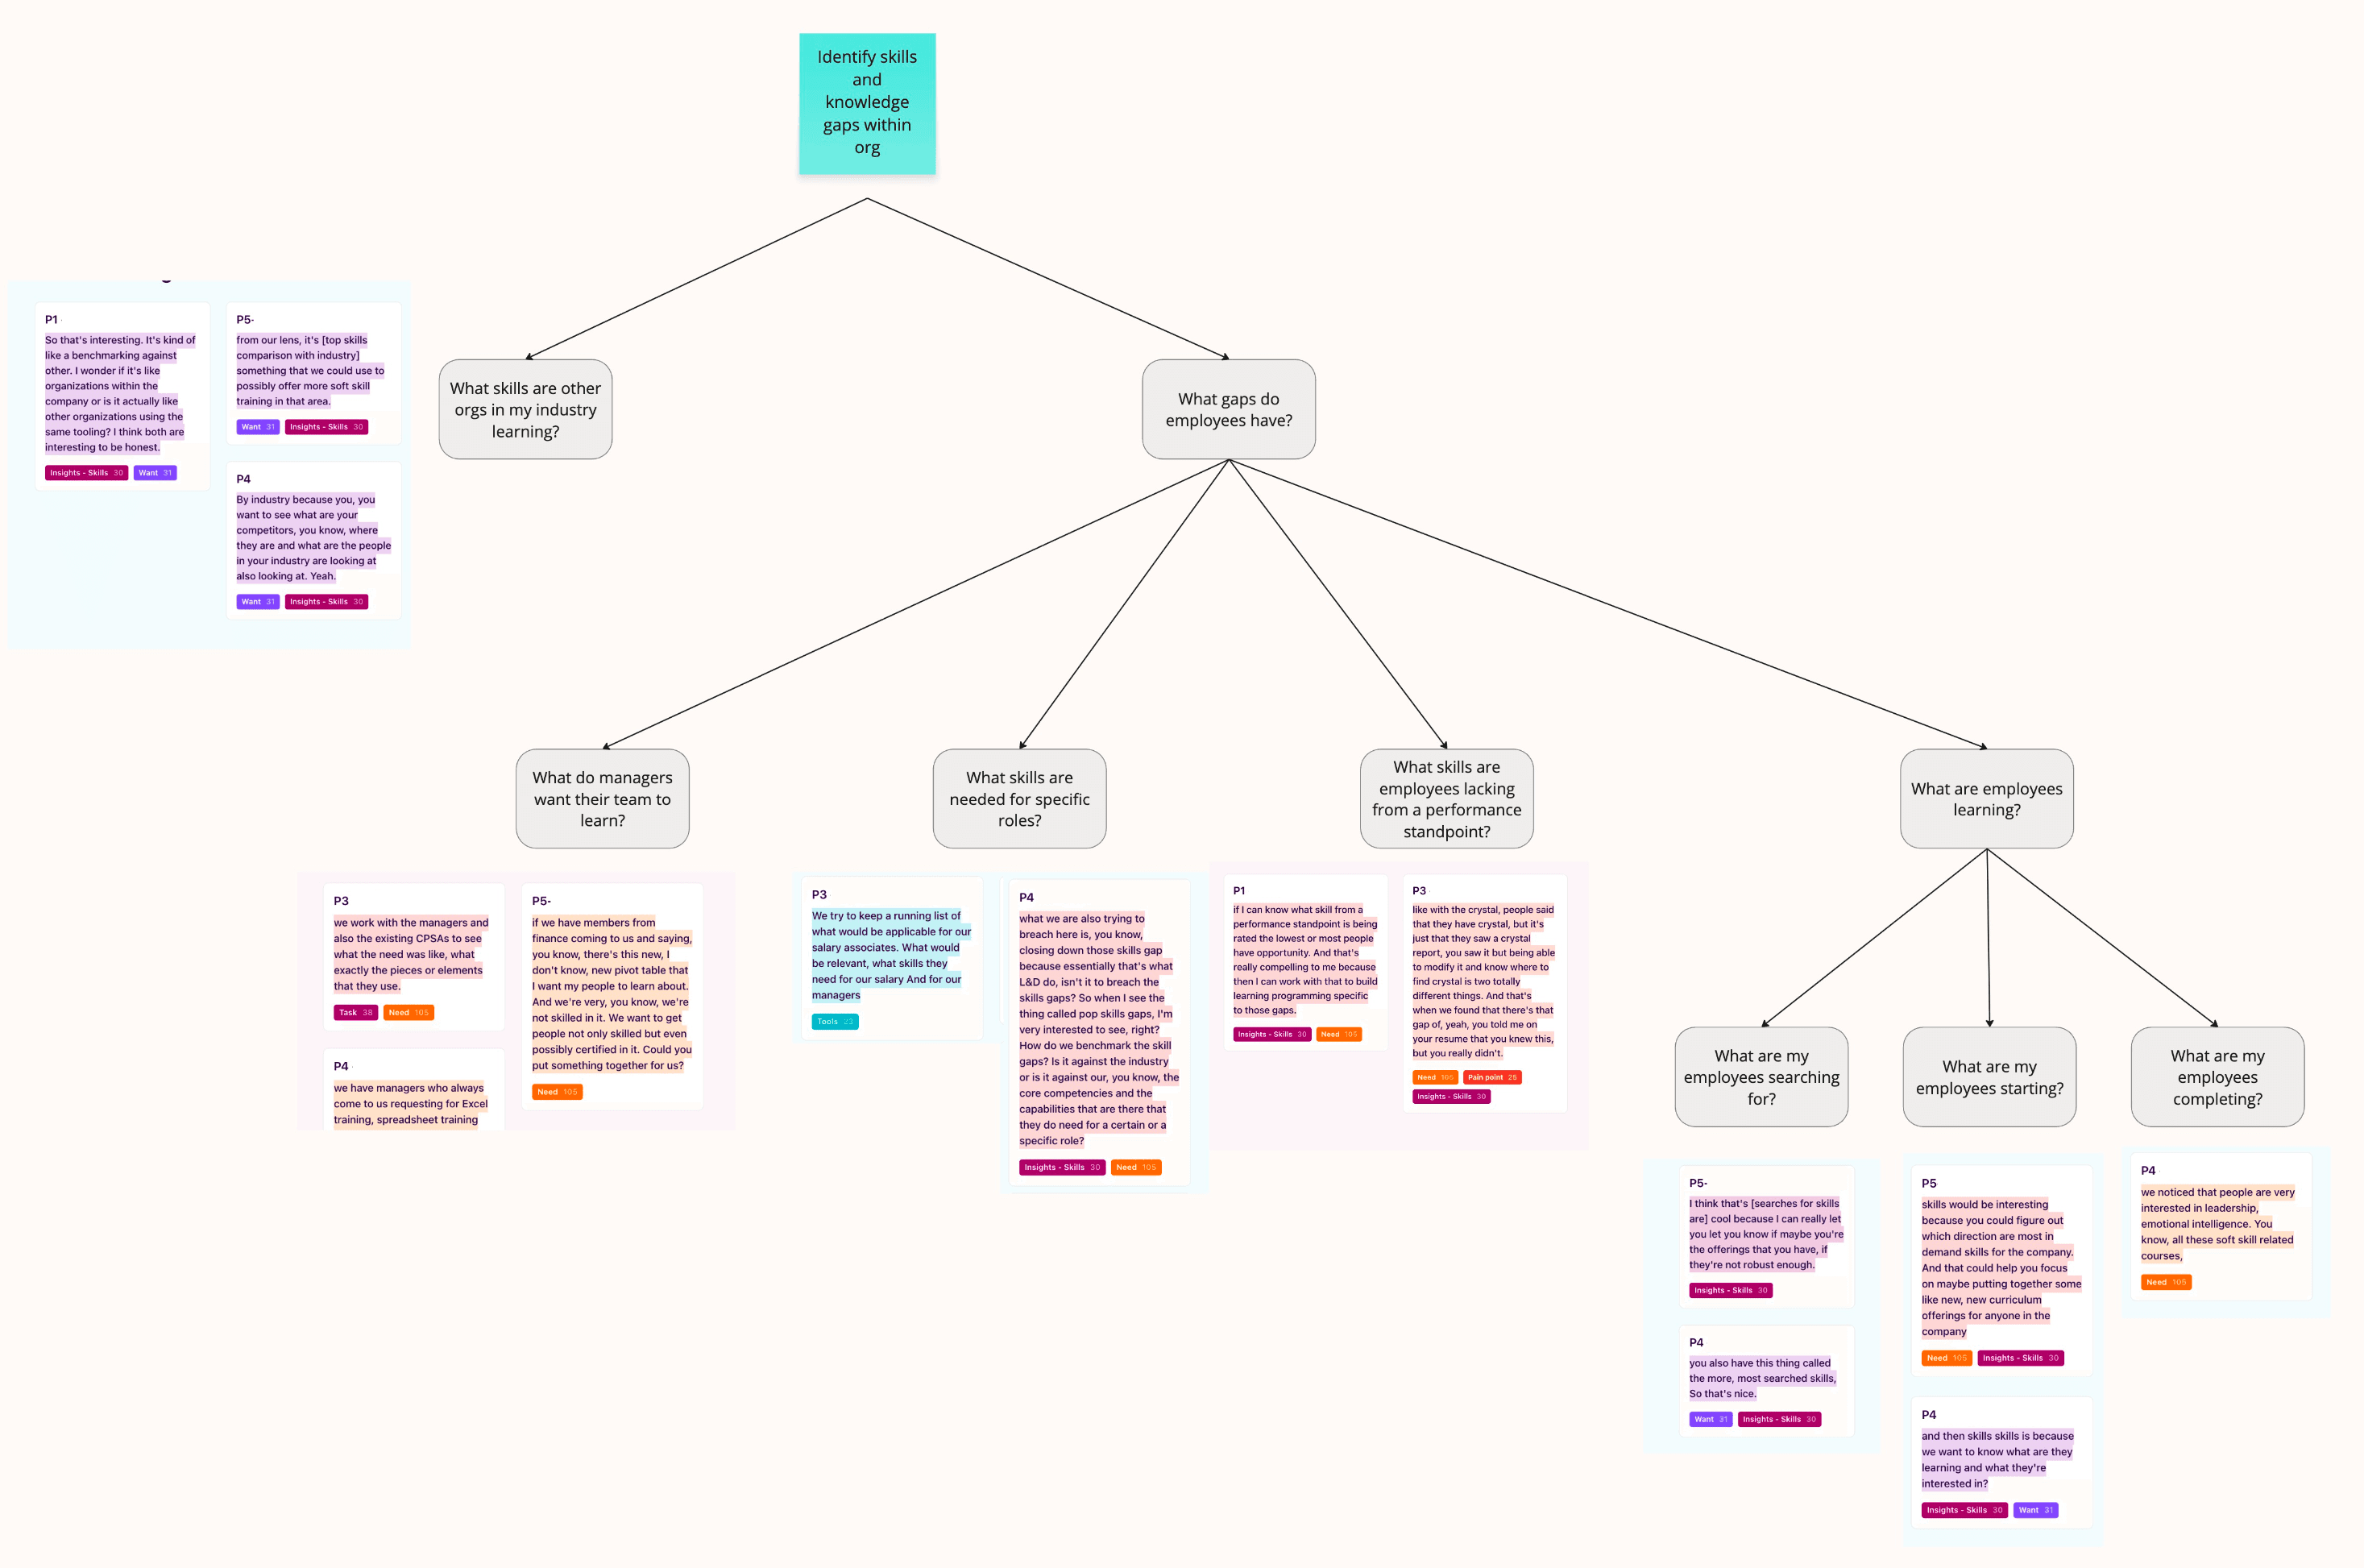
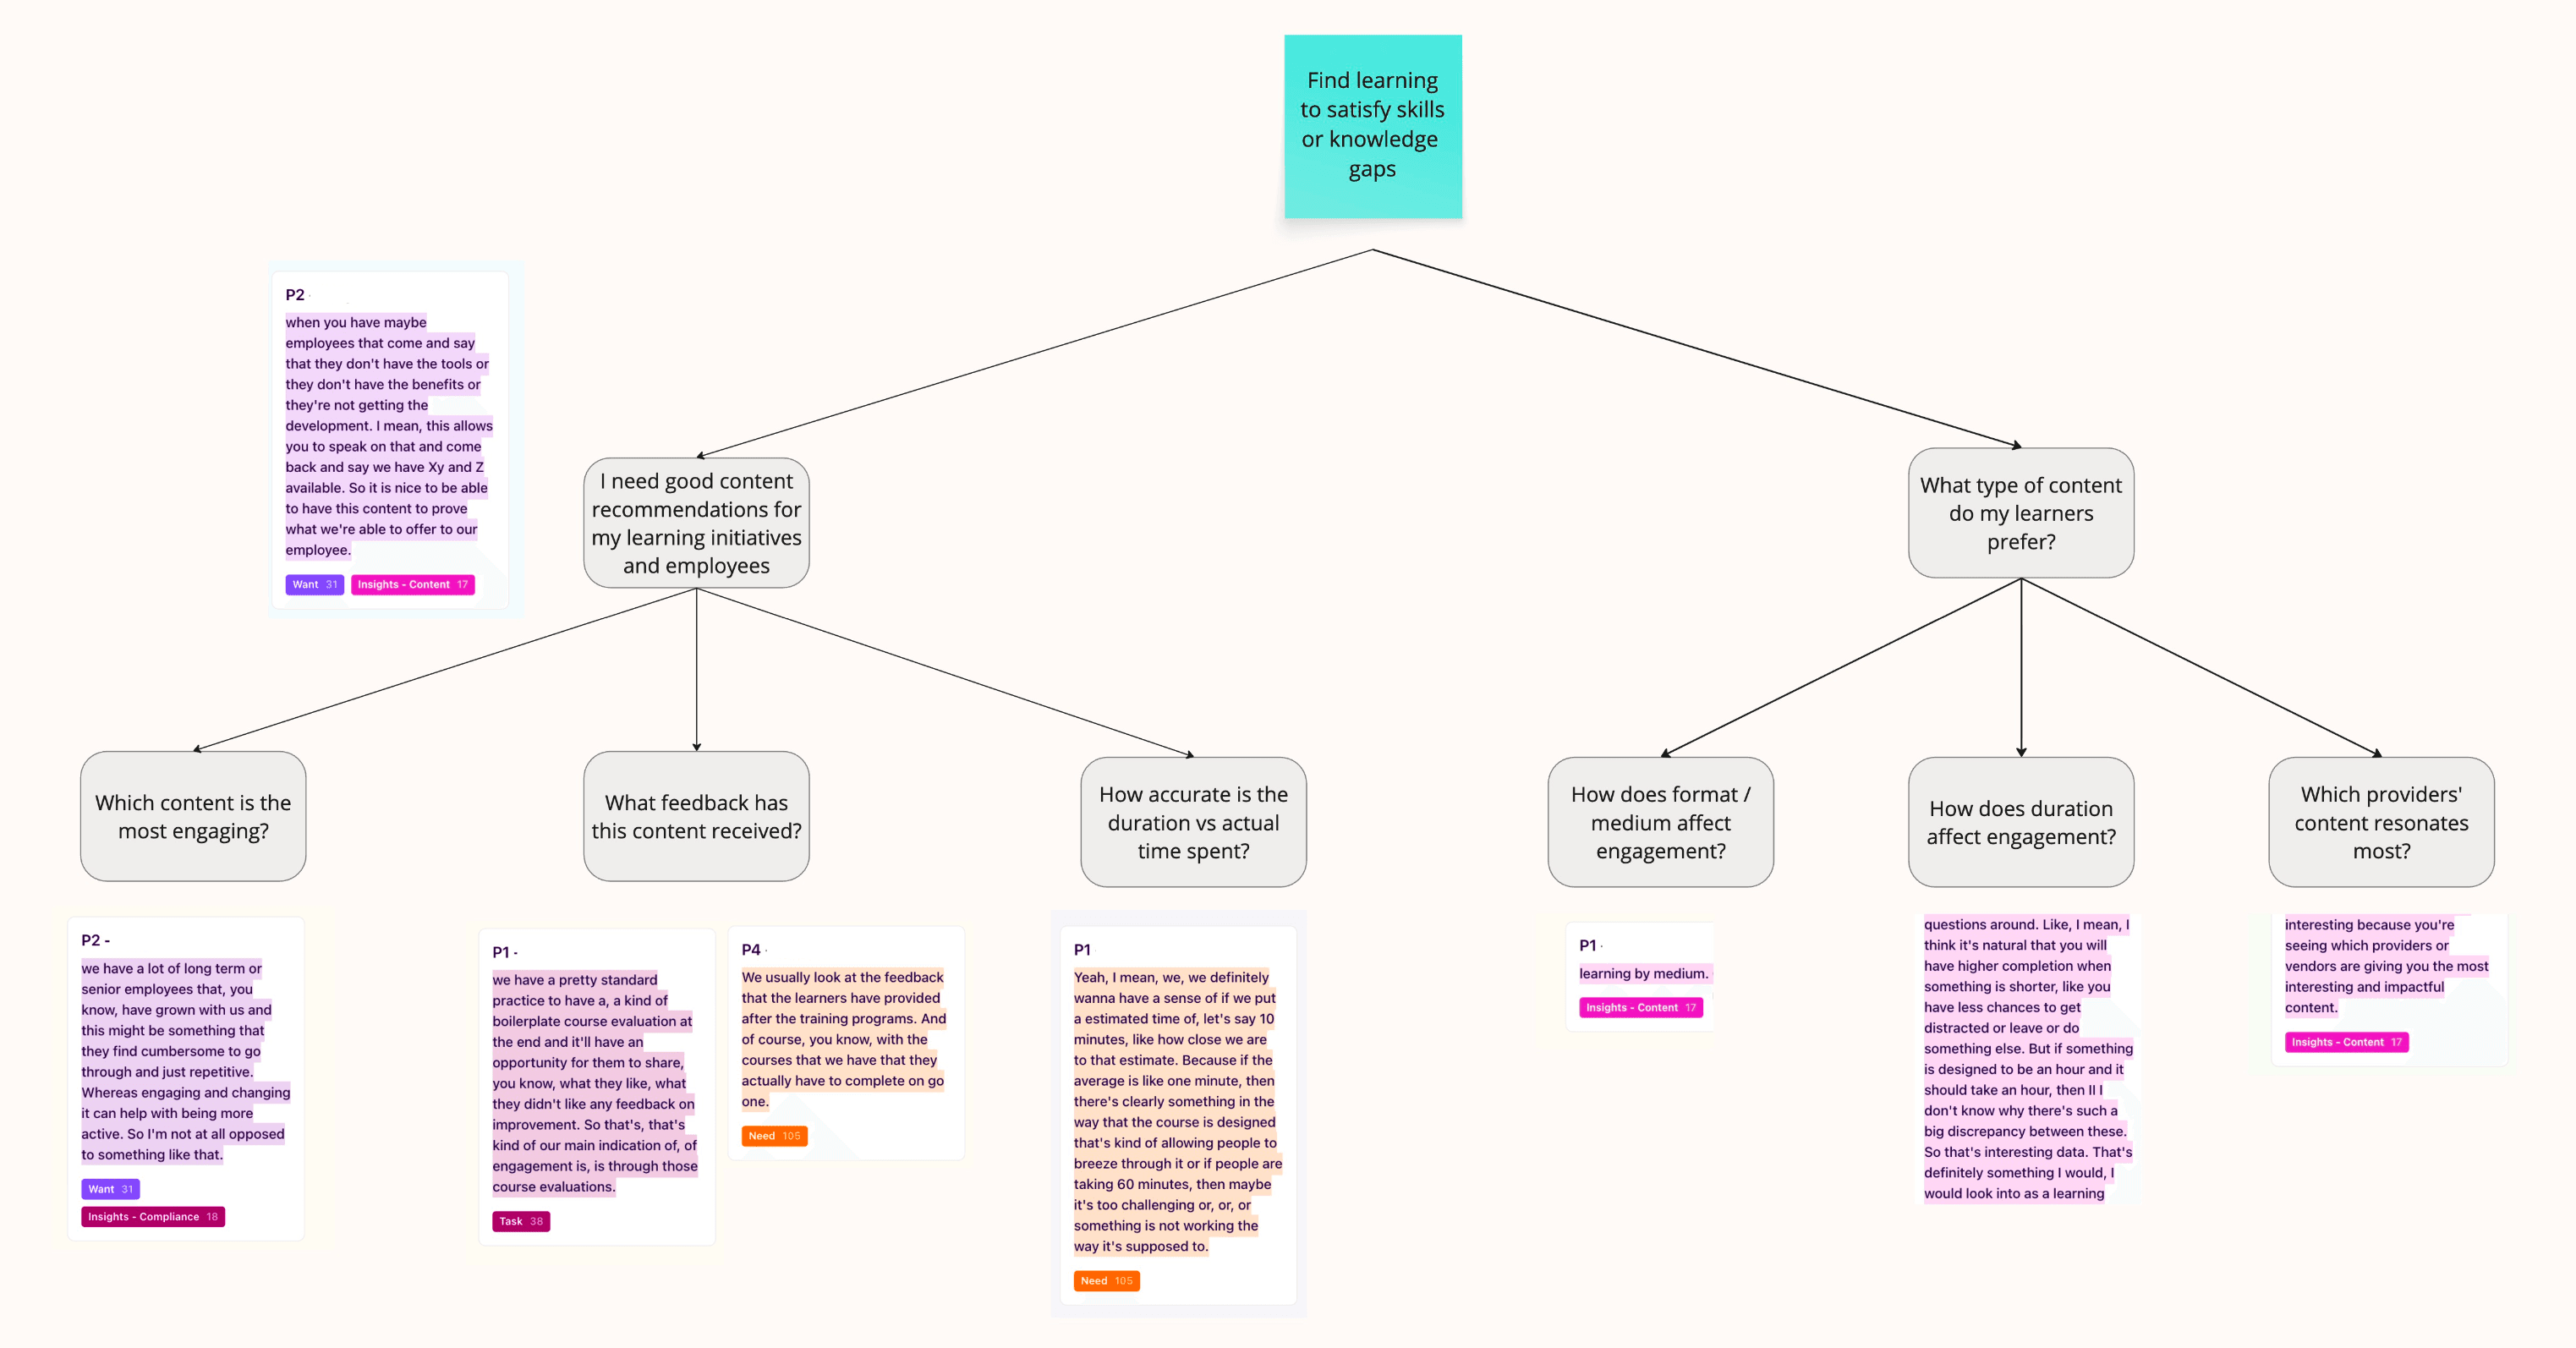
From there, we built out a single opportunity solution tree covering the full workflow, surfacing the specific needs, wants, and pain points behind each step. The two branches that mattered most for what came next were skills gaps and content discovery.
Concept Testing
We tested a range of concepts spanning Skills, Content, Compliance, and Impact insights, all drawn from an earlier vision for a Quarterly Learning Report. The goal was to understand which areas participants found most useful, and which required capabilities we didn't yet have.


Skills insights emerged as the clearest priority. Participants consistently showed the most interest here. Content insights ranked a clear second; despite being closer to Go1's existing bread and butter, it didn't generate the same pull.
Two areas we explicitly chose not to pursue: tying learning engagement to talent and people metrics like retention and employee engagement, since not every learning campaign used those metrics and it would have meant integrating with external systems outside our control; and basic learning engagement reporting, which external LMSes already handled. Building it ourselves would have been reinventing a wheel that worked.
The discovery research gave us enough confidence to narrow scope and move toward a first release.
Beta
The Beta was deliberately minimal. We'd just stood up a new skills taxonomy and the data relationships linking content to skills, so scope was capped at what that foundation could reliably support: a single "Top Skills" view showing learner counts, average time spent per skill, and an industry benchmark column. Twenty customers were given early access, and we followed up with evaluative interviews after two weeks.

Participants had no trouble interpreting the data, and the overall sentiment was positive despite the limited feature set. But the interviews were most useful for what they revealed about the ceiling. Compliance learning was drowning out upskilling signals. Admins needed a way to filter between the two. A single month of data wasn't enough to trackcampaigns that ran across quarters. And the industry benchmark, while compelling in concept, generated confusion about what was actually being compared.
“The industry benchmark is interesting but I'm not sure what I'm being compared to.”
Beta participant
There was a more foundational issue too. Since Insights was pulling from data sources that had never been surfaced to admins before, a couple of participants spotted learner counts that didn't match what they knew to be true from training they'd run recently. For a brand-new data product, this mattered more than any individual feature gap — if admins couldn't trust the numbers, nothing built on top of them would matter either. We treated it as a priority fix going into V2, ahead of new features.
A subtler problem surfaced too: skills were sometimes too granular. A single course like “Security awareness training” could fragment into several narrowly-specific skills in the list, like “Reporting safety concerns” and “Responding to an active shooter.” Only a couple of participants flagged it, likely because without a way to drill into a skill yet, there was nothing to expose the fragmentation. We didn't fix it for Beta — there wasn't enough signal yet to know if it was a real problem or an edge case — but flagged it as something to watch once the skill detail view shipped and admins could actually see what sat behind each skill.
V2
V2 was built across four milestones, some of which targeted gaps the Beta had surfaced. The upskilling filter came first, allowing admins to toggle between compliance and upskilling learning, with upskilling as the default, so the skills list finally reflected the growth culture they were trying to build. Longer timeframes followed, introducing quarterly views that matched the cadence of real L&D campaigns. A skill detail view then gave admins the ability to click into any skill and see the content driving it, the learners developing it, and top-rated industry content they could curate directly into their library. The final milestone widened the lens further by surfacing emerging skills trending across an organisation's industry, giving admins a reason to return to Insights regularly rather than only when checking a specific program.

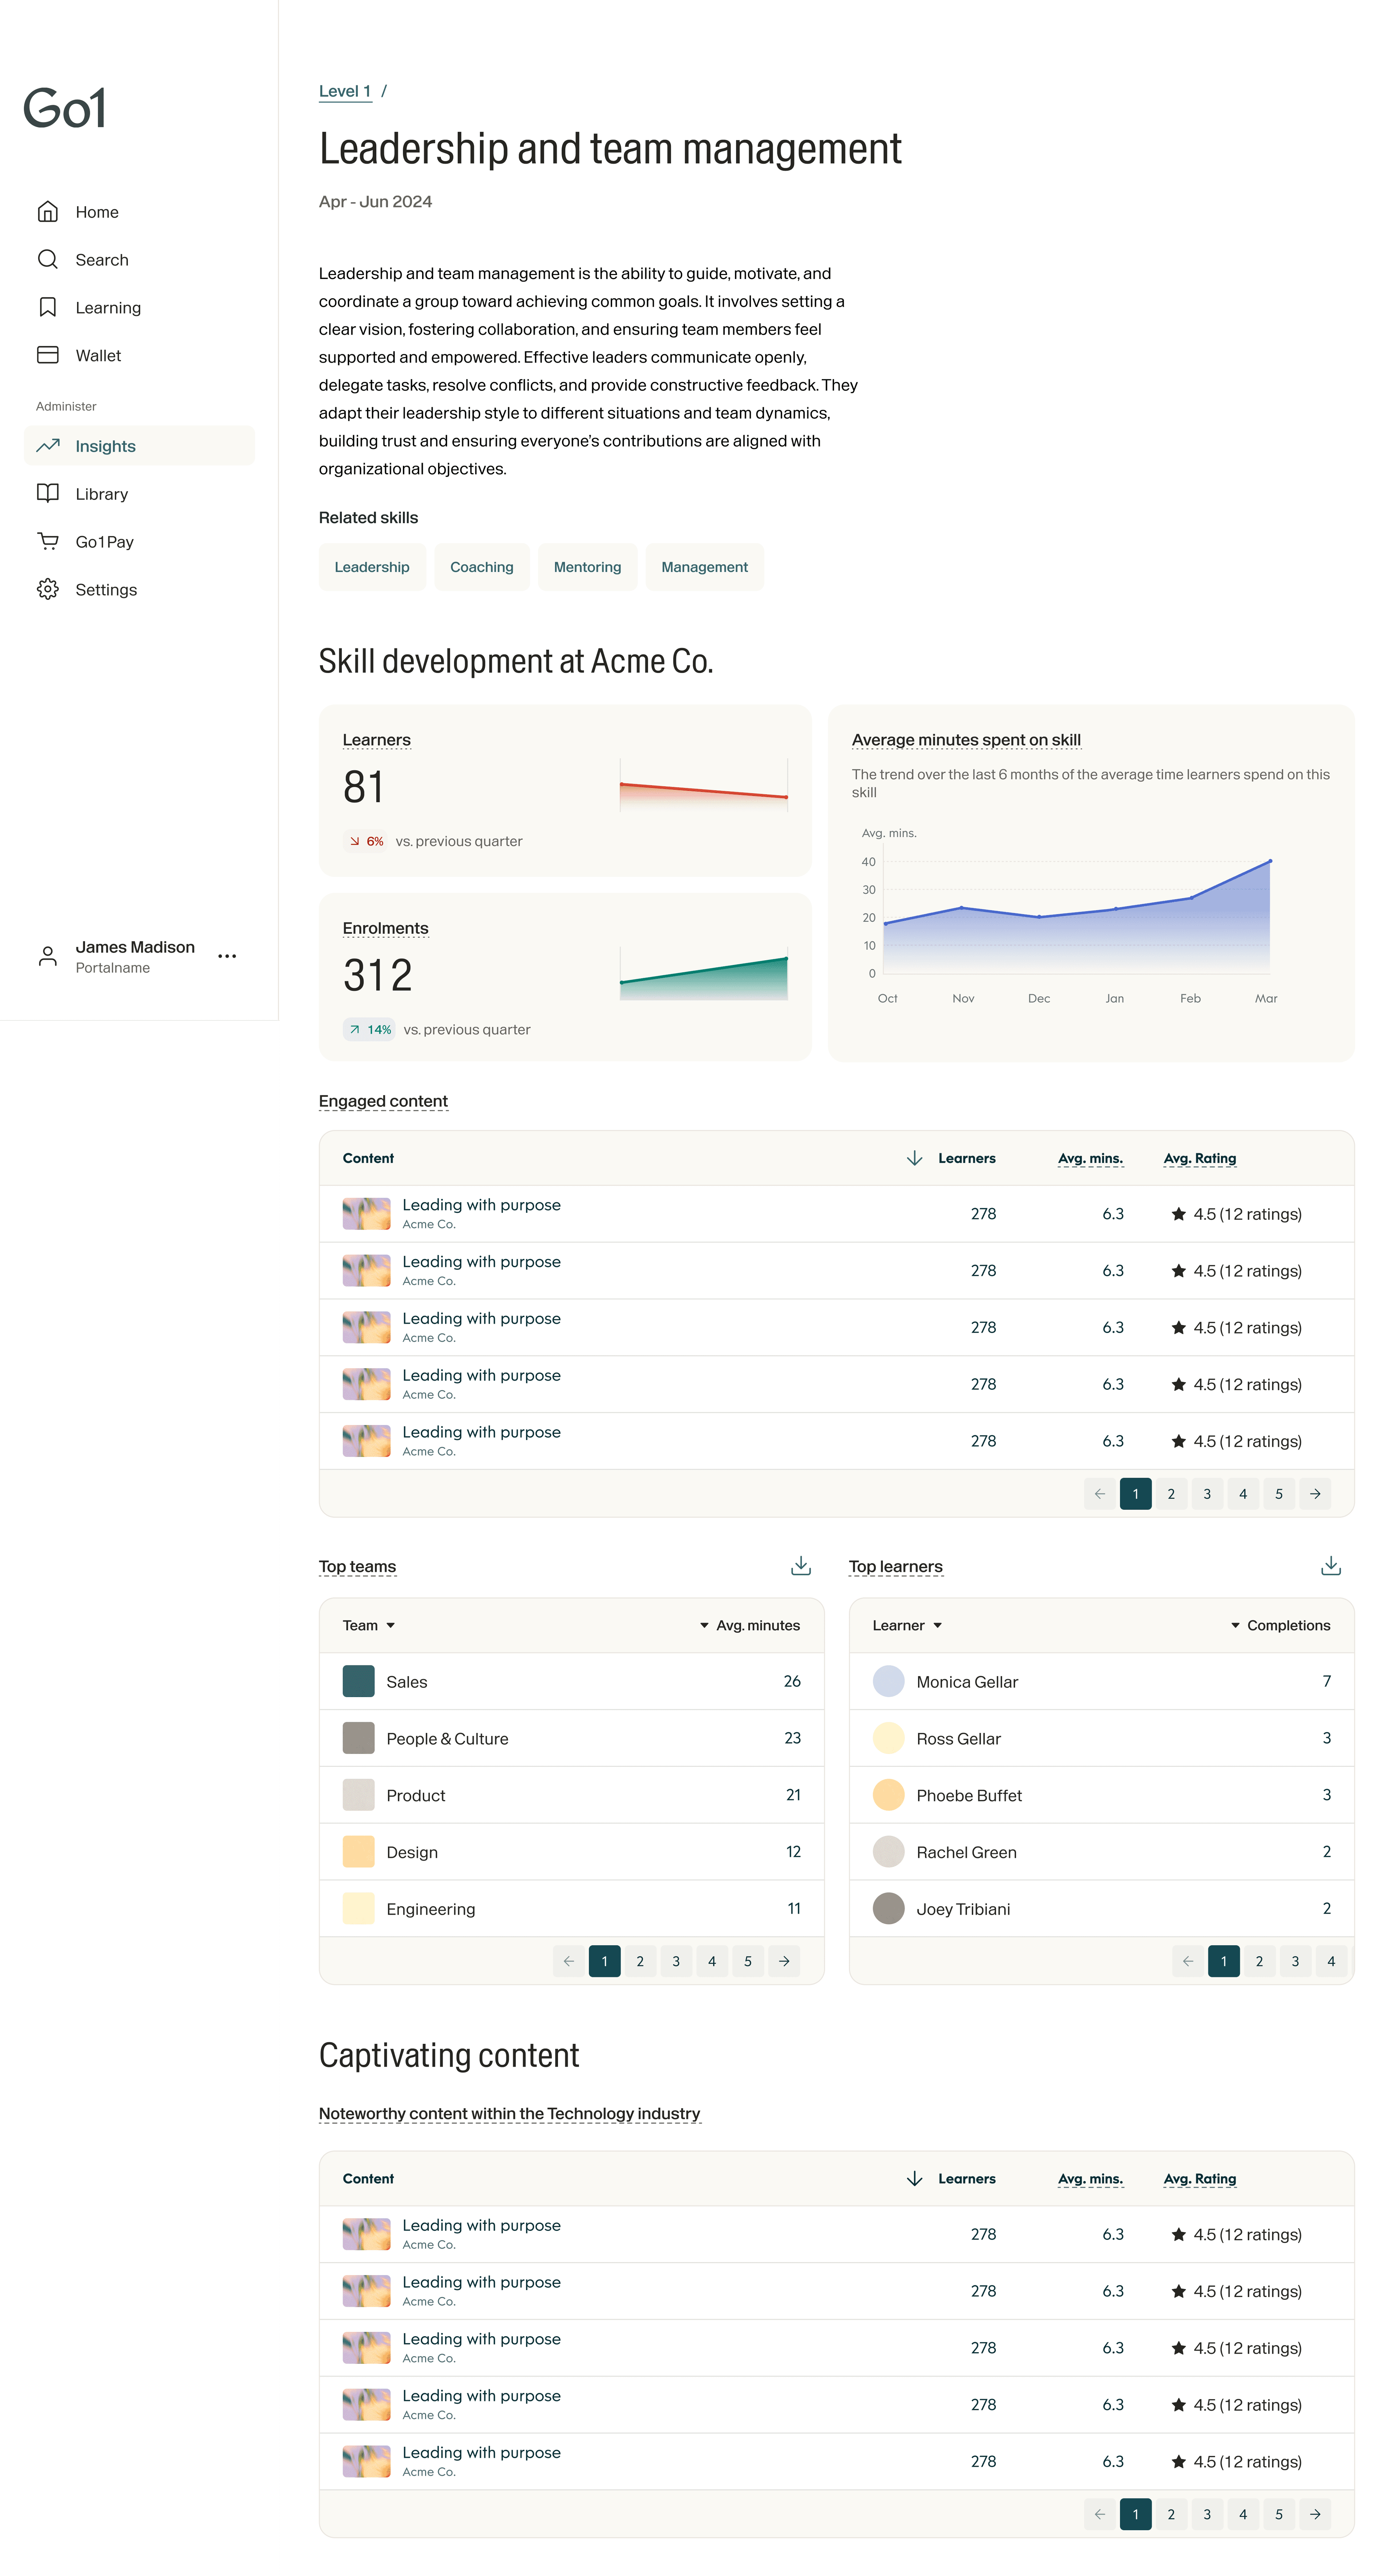
Skills insights V2 and beyond
Content Insights
A parallel workstream tackled Content Insights, an area that was effectively starting from zero, or worse than zero as a matter of fact. Since the previous content insights page had been retired ahead of its replacement, leaving admins without a feature they'd relied on. What existed before that was a basic count of thumbs up and thumbs down responses for each piece of content: a blunt instrument that told admins very little about whether their learning was actually working. The goal was to build something genuinely useful in its place, and to do it quickly.
“The thing I miss most is basic information like viewing statistics of our courses and the written feedback of users on what they liked or disliked.”
L&D manager, via Typeform feedback
The new Content Insights surfaced five-star ratings and written learner feedback for every piece of content in an admin's library, giving them a real signal on what was landing and what wasn't. Crucially, this cut both ways — admins were just as keen to surface their worst-performing content as their best, since that's where corrective action was actually needed. Beyond their own portal's data, admins could also see content that was trending and highly rated across their industry, opening up a new curation pathway. And to make the volume of qualitative feedback digestible, AI-generated summaries surfaced the key themes from learner reviews without requiring admins to read through every comment individually.

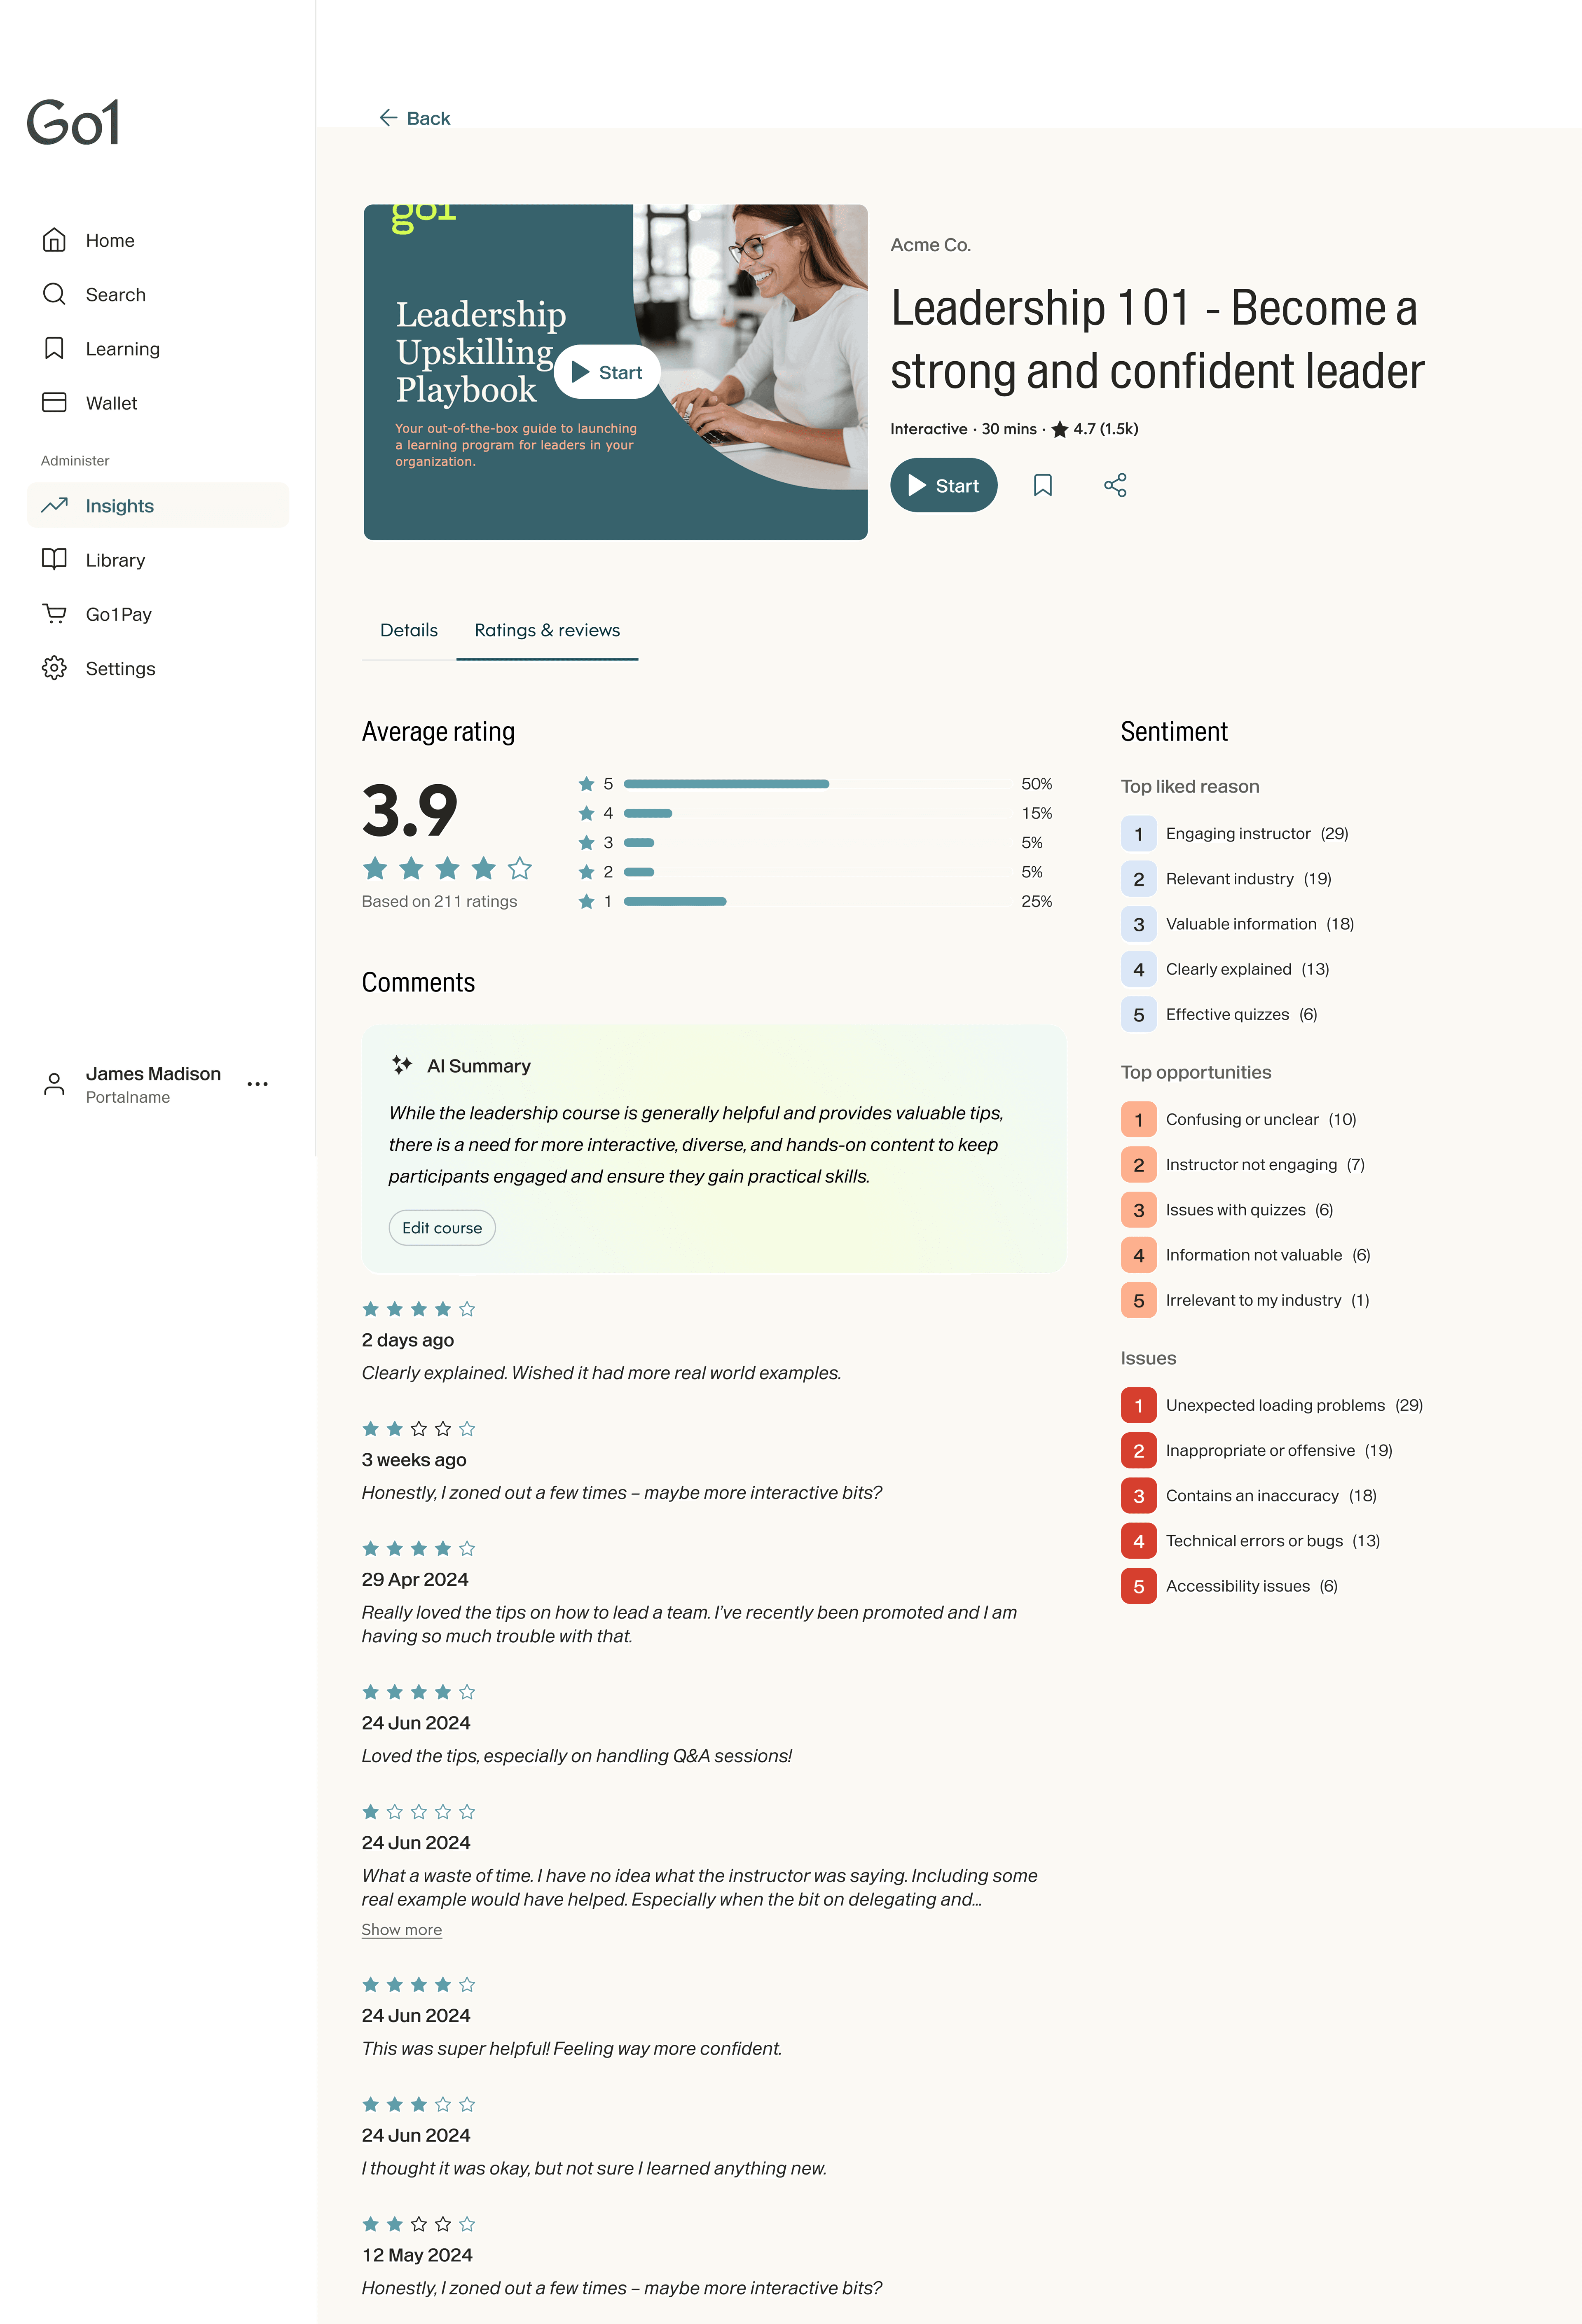
Content insights
Outcomes
Since launching in October 2024, the product has accumulated over 15,000 sessions from around 7,000 unique visitors. Sessions grew from near zero at launch to a peak of around 550 per week by the end of the year. This is roughly a 3x increase over the period and have sustained at around 450–500 since.
The more meaningful signal is what admins are doing within those sessions. Exploratory actions, where they delve deeper into skills data, now account for 28% of all sessions, up 85% since launch. Curation actions, where admins save or add content to their library directly from Insights, account for 5%. Both of these were zero when the product launched; they only became possible as V2 milestones shipped.
What building this product taught me is that analytics features are uniquely sensitive to the gap between what's visible and what's actionable. A number without context doesn't inform — it just prompts another question. Every milestone in V2 was essentially an attempt to close that gap a little further: more context, more depth, more ways to act on what you're seeing. The exploratory and curation data reflects exactly what we set out to achieve — admins treating Insights less like a dashboard to check and more like a tool to work with.