Go1 · 2023
Simplifying Reporting for Efficiency
TL;DR
Reporting was one of Go1's most persistent customer frustrations, costing approximately 2000 support hours annually and consistently ranking in the top five complaints. As Senior Product Designer on the L&D Manager experience, I led the research and redesign of the reporting feature. Usability testing validated the direction strongly, and when the initiative was later deprioritised, customer churn told the story we already knew. Reporting has now been built, with the original research and design as its foundation.
Customer interviews · Opportunity solution tree · Concept testing · Wireframing · Usability testing · UI design · Prototyping · Design system
Certain information has been omitted or obfuscated in this case study. The opinions presented here represent my views alone, not of my current or past employers.

Reporting had long been a source of frustration for L&D managers using the Go1 platform. Although the reporting toolkit was technically capable and mimicked database functionality, it was designed without considering the technical expertise of its primary users. The result was a powerful system that most people couldn't use confidently. During my first year and a half at Go1 where I focused on the L&D Manager experience, fixing reporting became one of the most significant problems I worked on.
Discovery
The business case was clear before any research began. Approximately 2000 support hours were spent annually on reporting queries. This was the equivalent of a full-time staff member answering only reporting questions for an entire year. The reporting suite was also built on legacy technology, making even minor updates a significant engineering effort. But understanding the why behind the frustration required talking to the people experiencing it.
Customer Interviews
We spoke to eight L&D managers from a diverse range of organisations, from medium to enterprise-sized, spanning education, retail, logistics, insurance, engineering, law, agriculture, and healthcare. Rather than asking them to describe their problems in the abstract, we asked them to show us what reporting meant to them — how they set up reports, what they did with the results, and where things broke down.

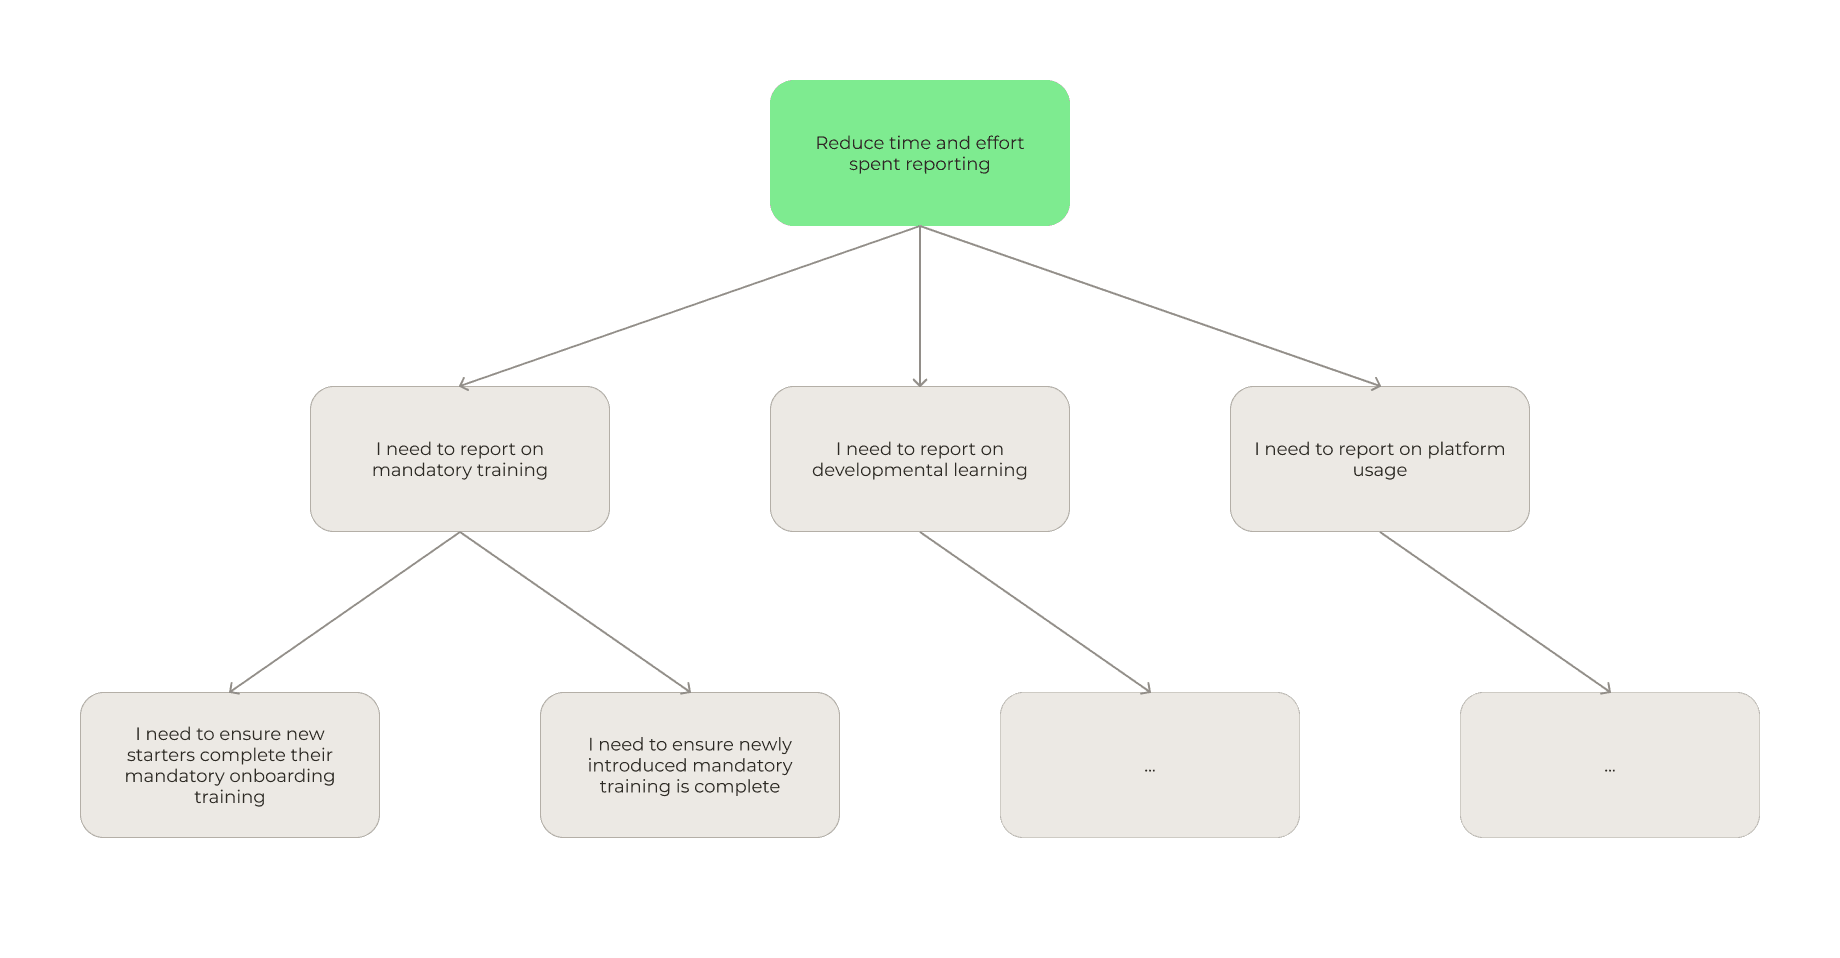
The most important insight was that reporting wasn't a single job. L&D managers report for fundamentally different reasons: ensuring mandatory training is complete, monitoring developmental learning, and understanding platform engagement. Each of these have different data needs, different audiences, and different definitions of success, yet the existing tool treated them all the same way.
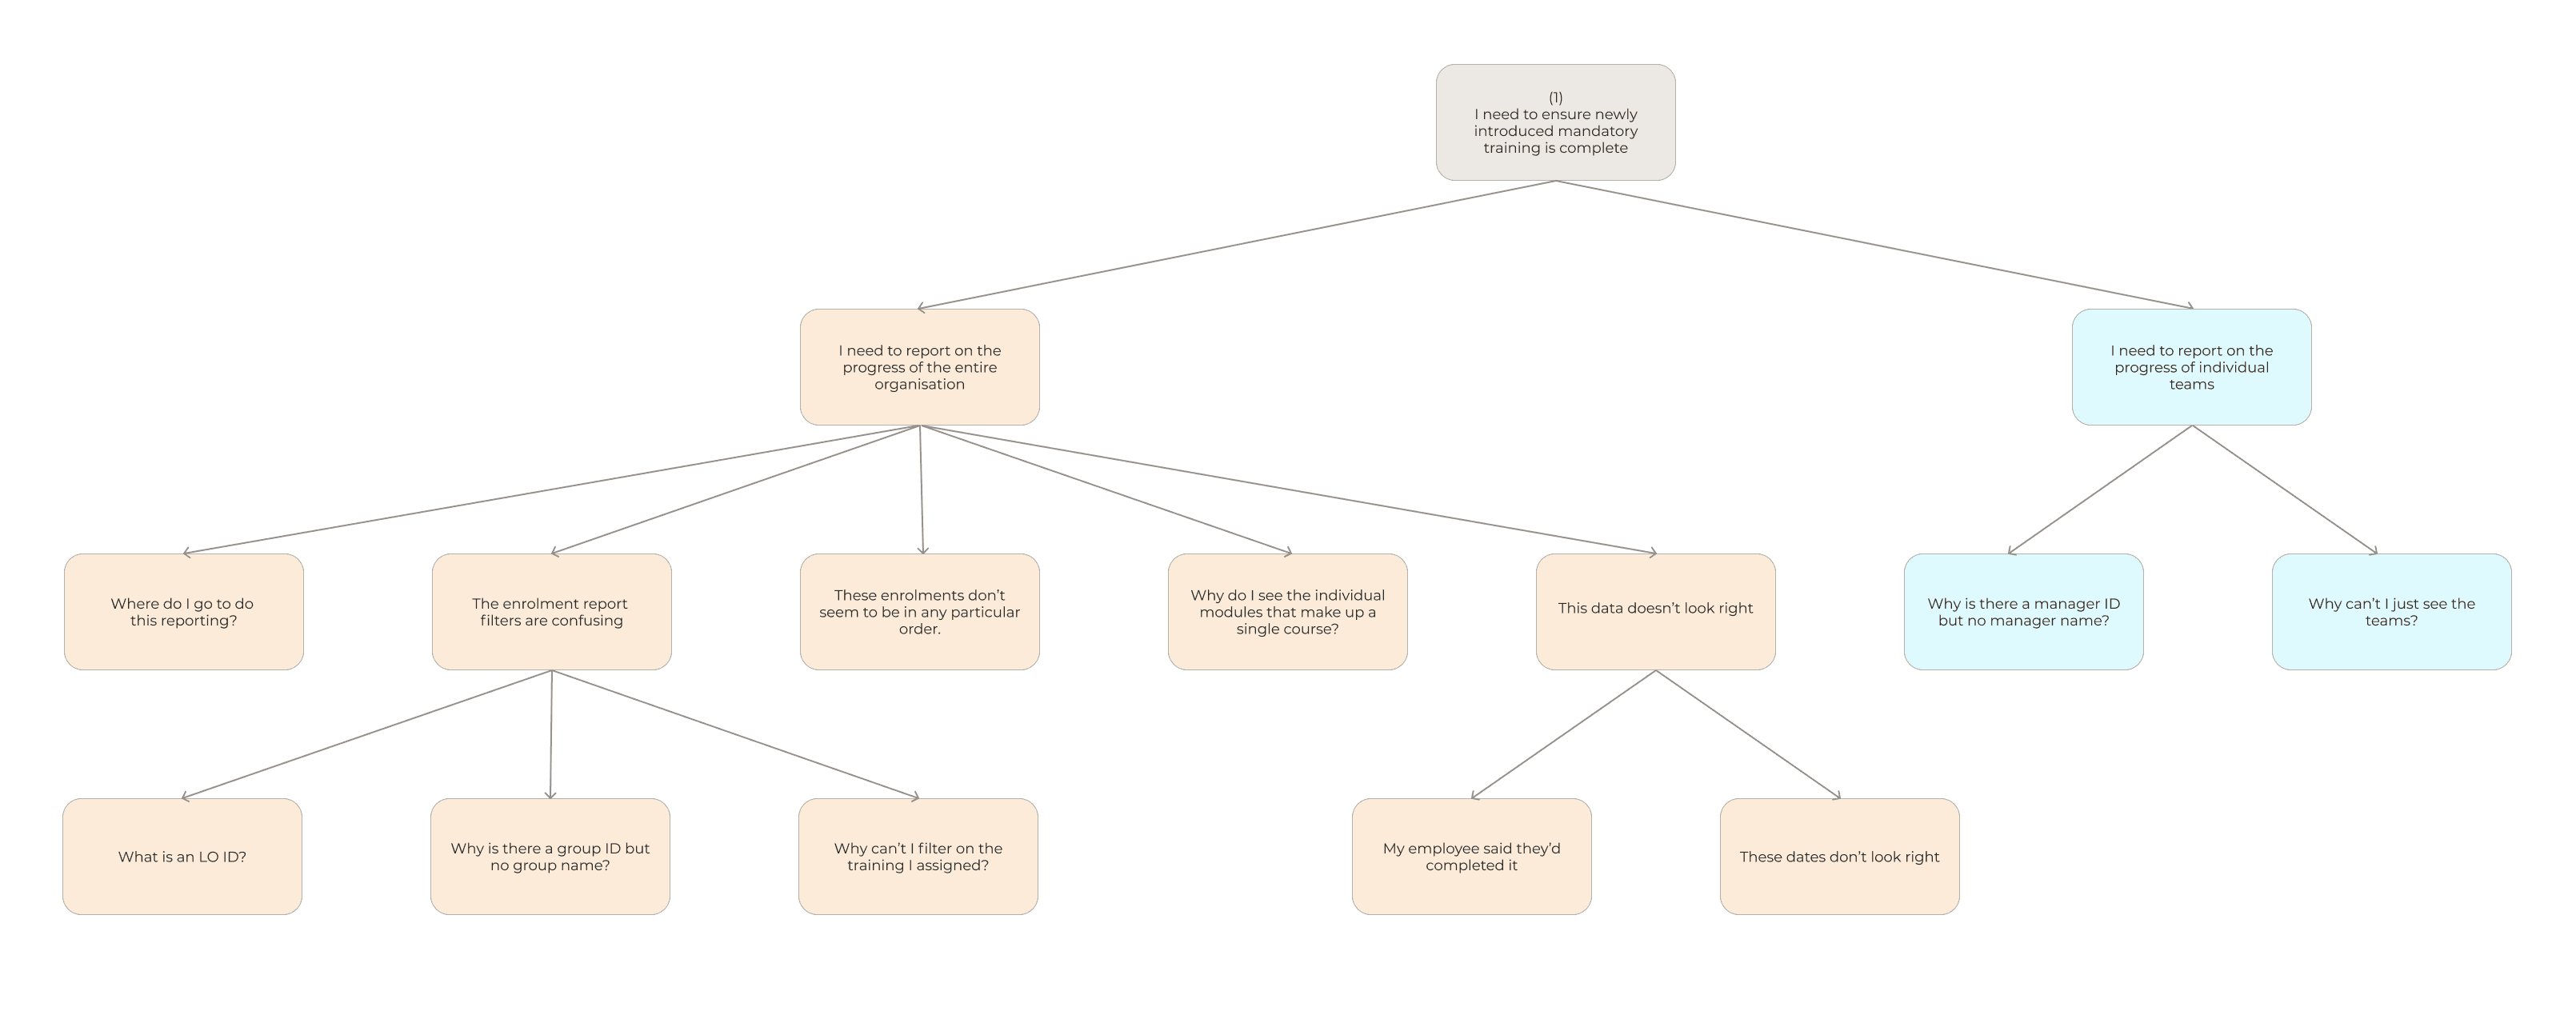
To help convey this message and highlight the current friction points, we mapped our findings into an opportunity solution tree. This also ensured the opportunities we identified were grounded in research and aligned with the outcome we wanted — reduce the time and effort spent reporting.
Given the scope, we narrowed our focus to mandatory training reporting, which was the most common requirement across the businesses we spoke to. Some key friction points were data accuracy, which reporting surface to use and working with the data in the enrolments report.
Solution Exploration
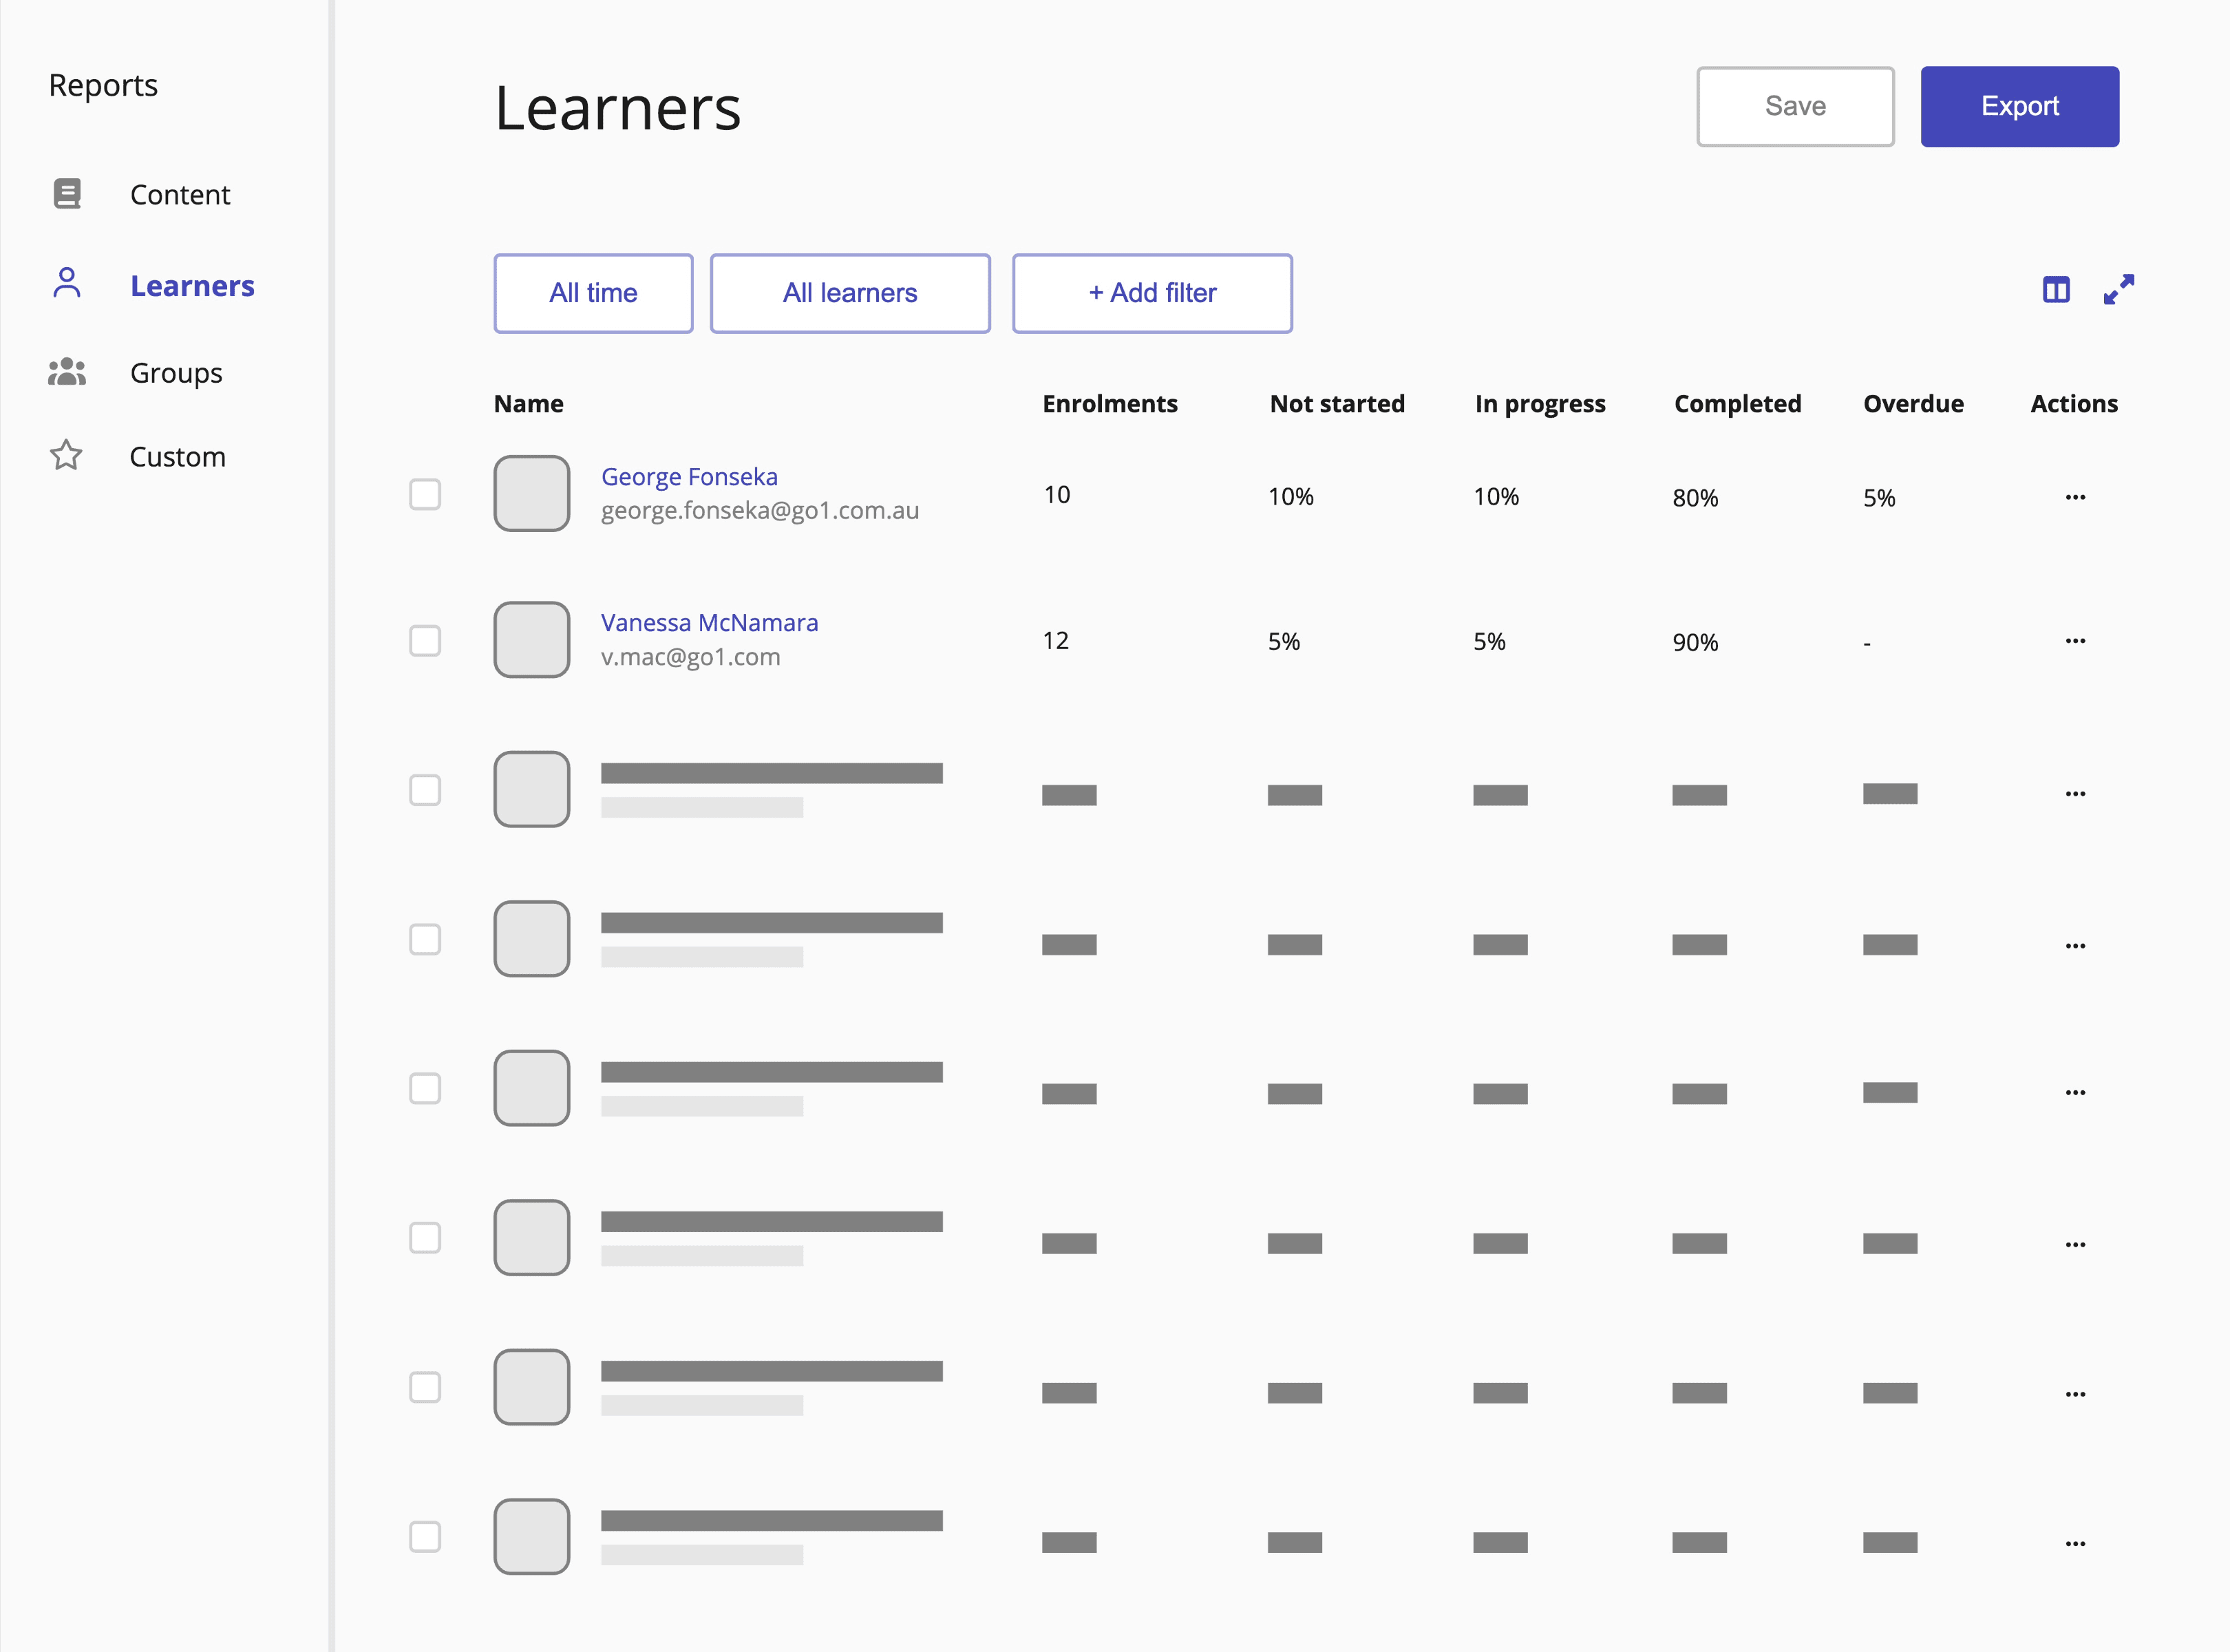
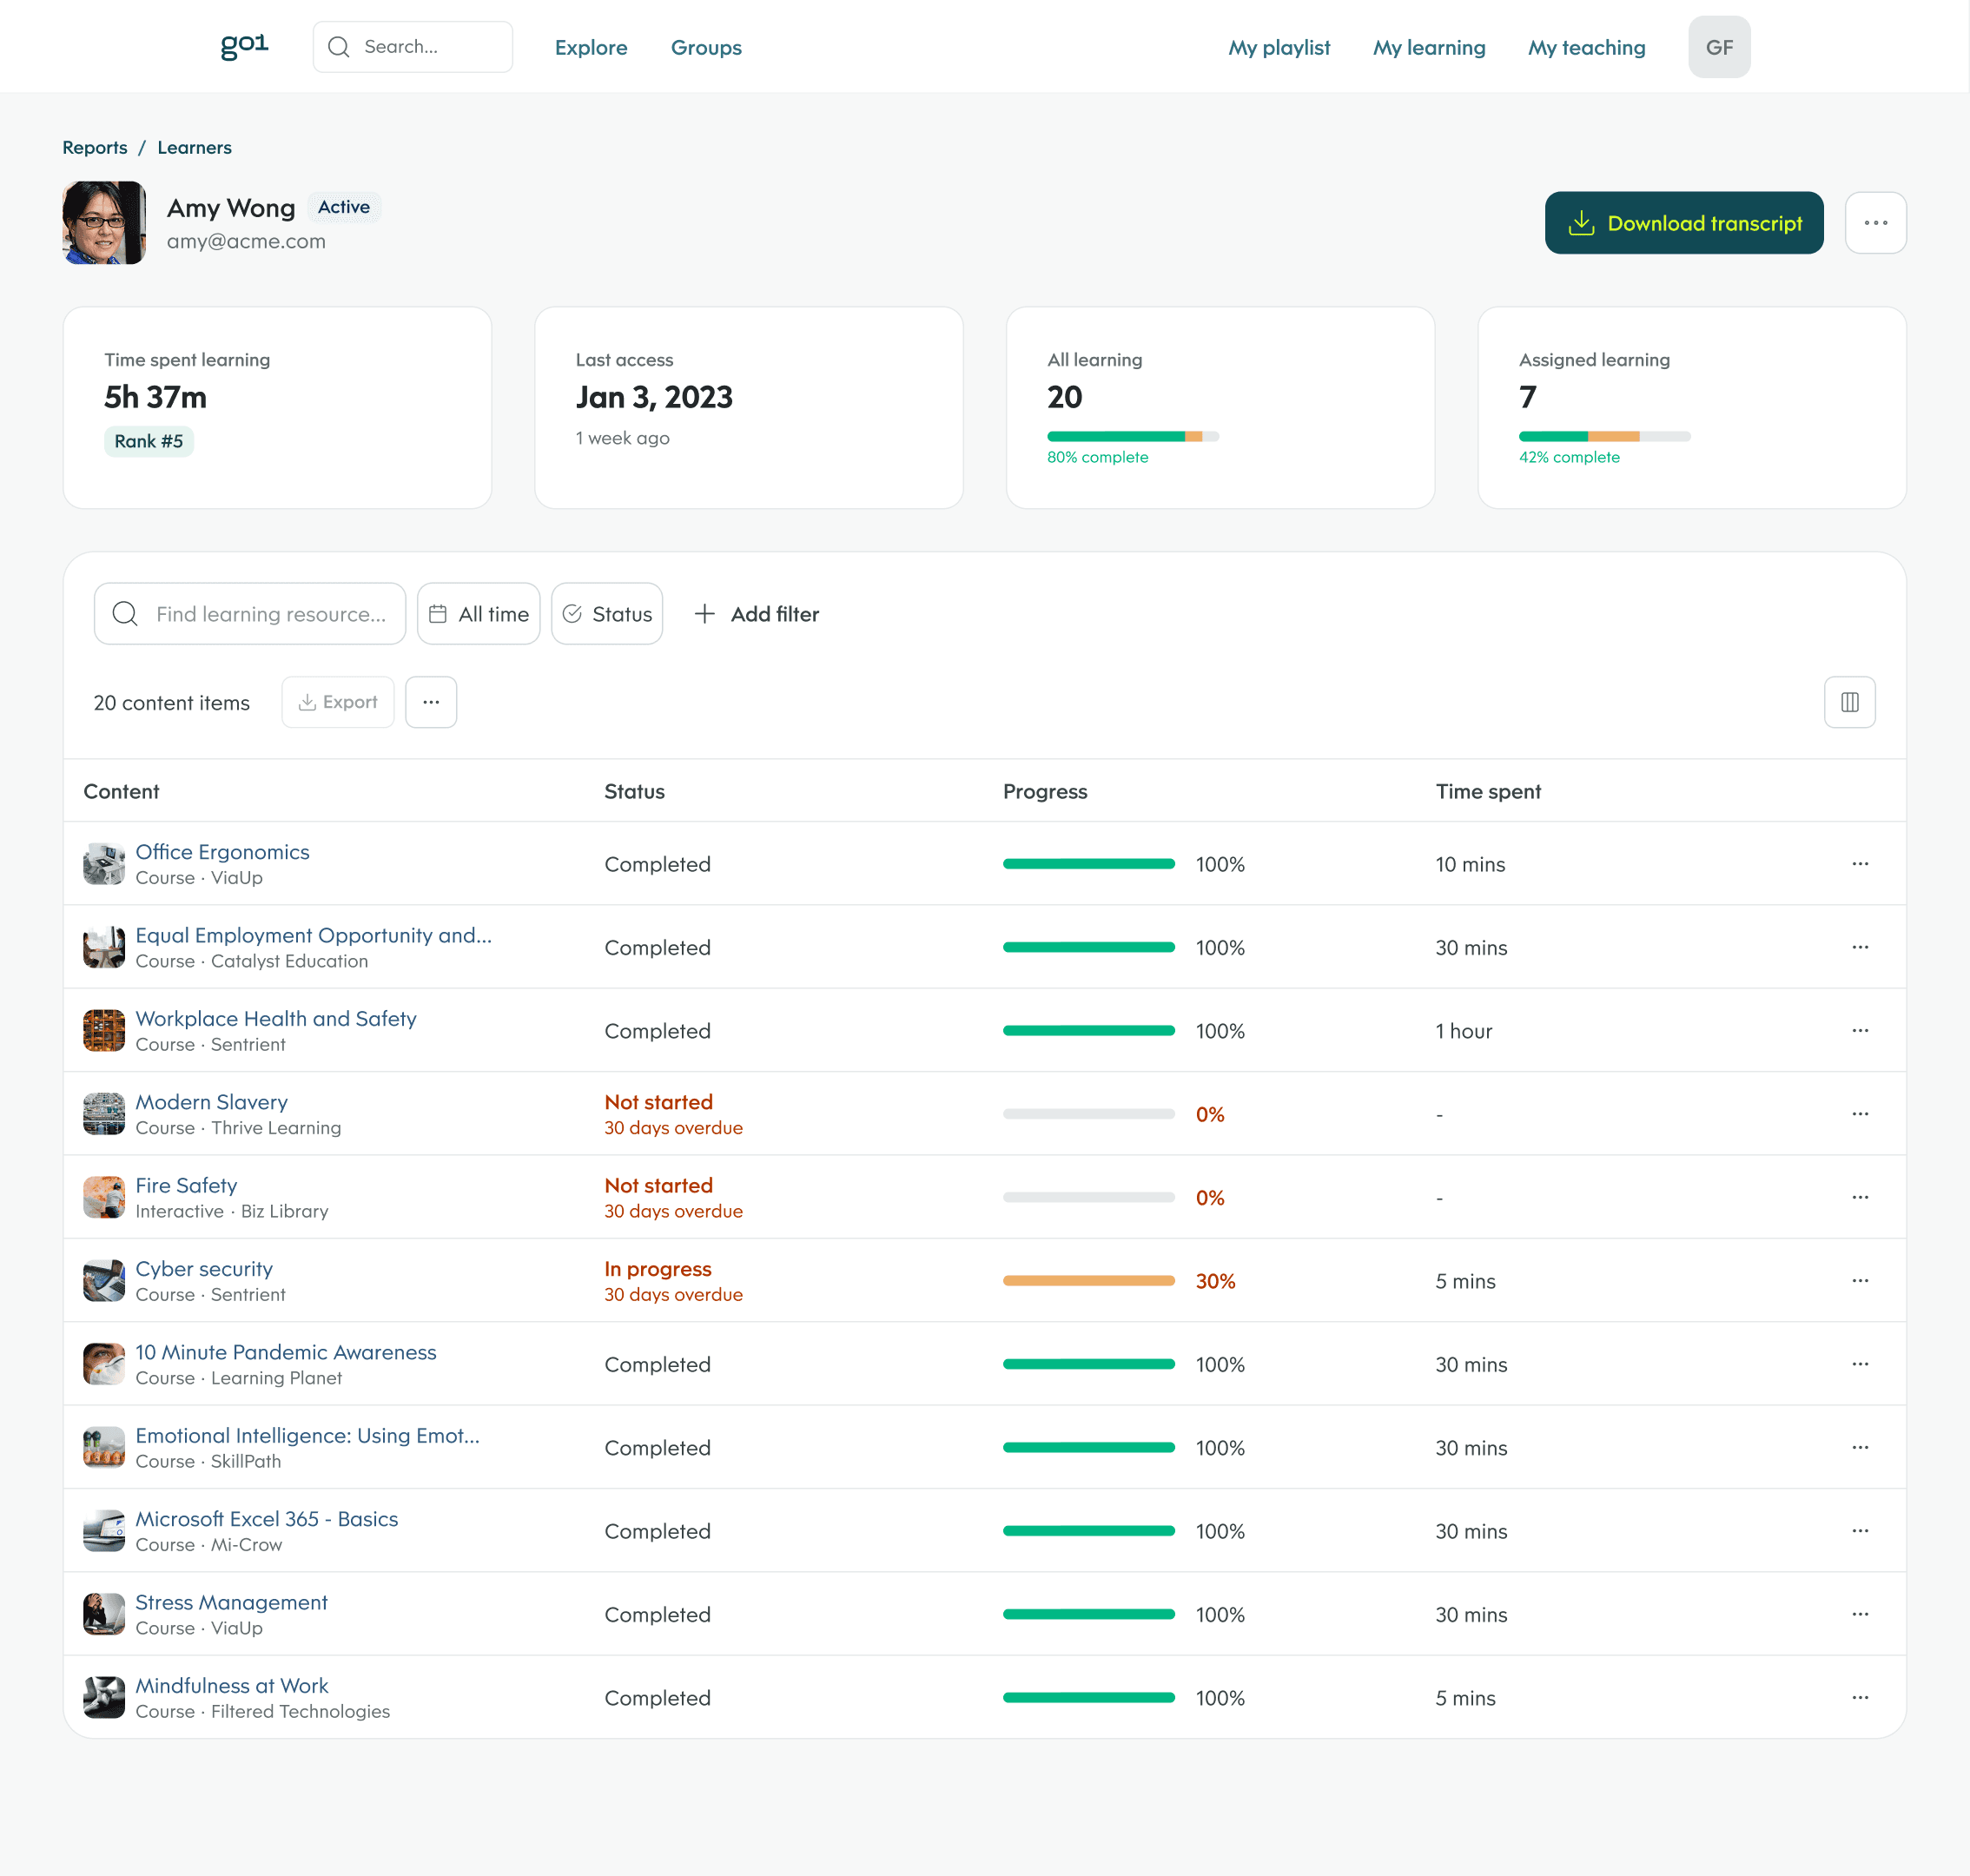
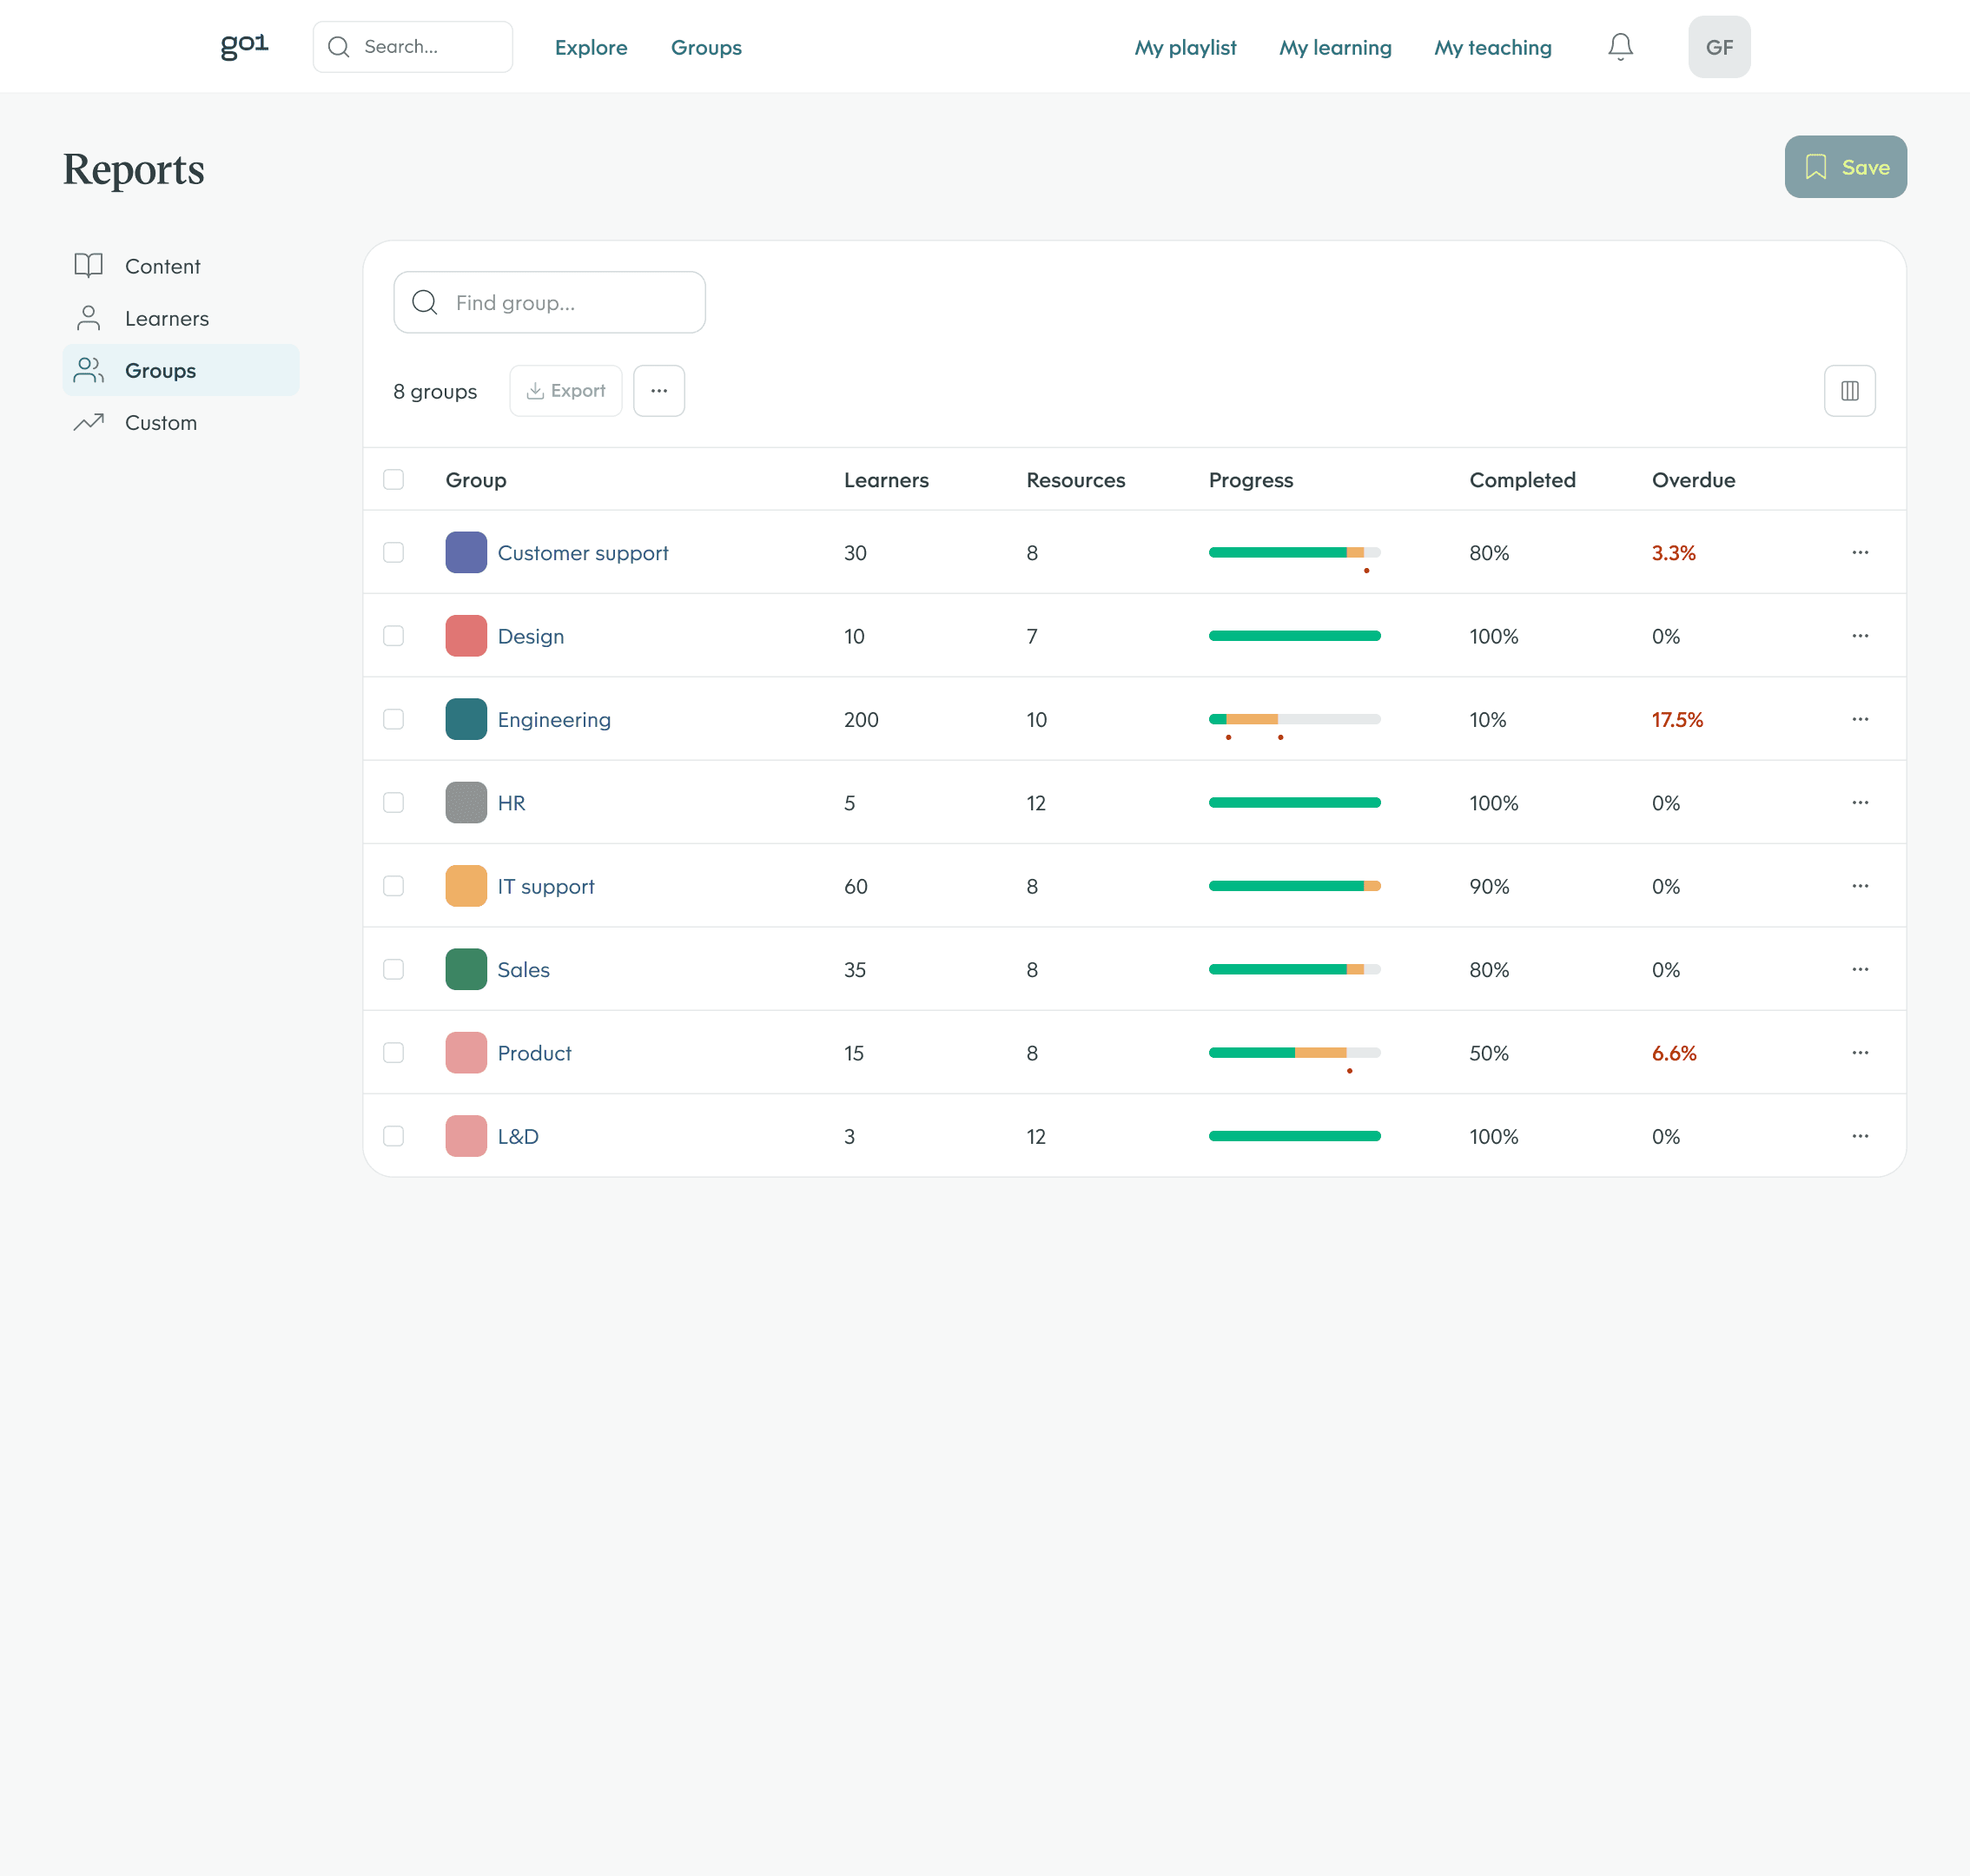
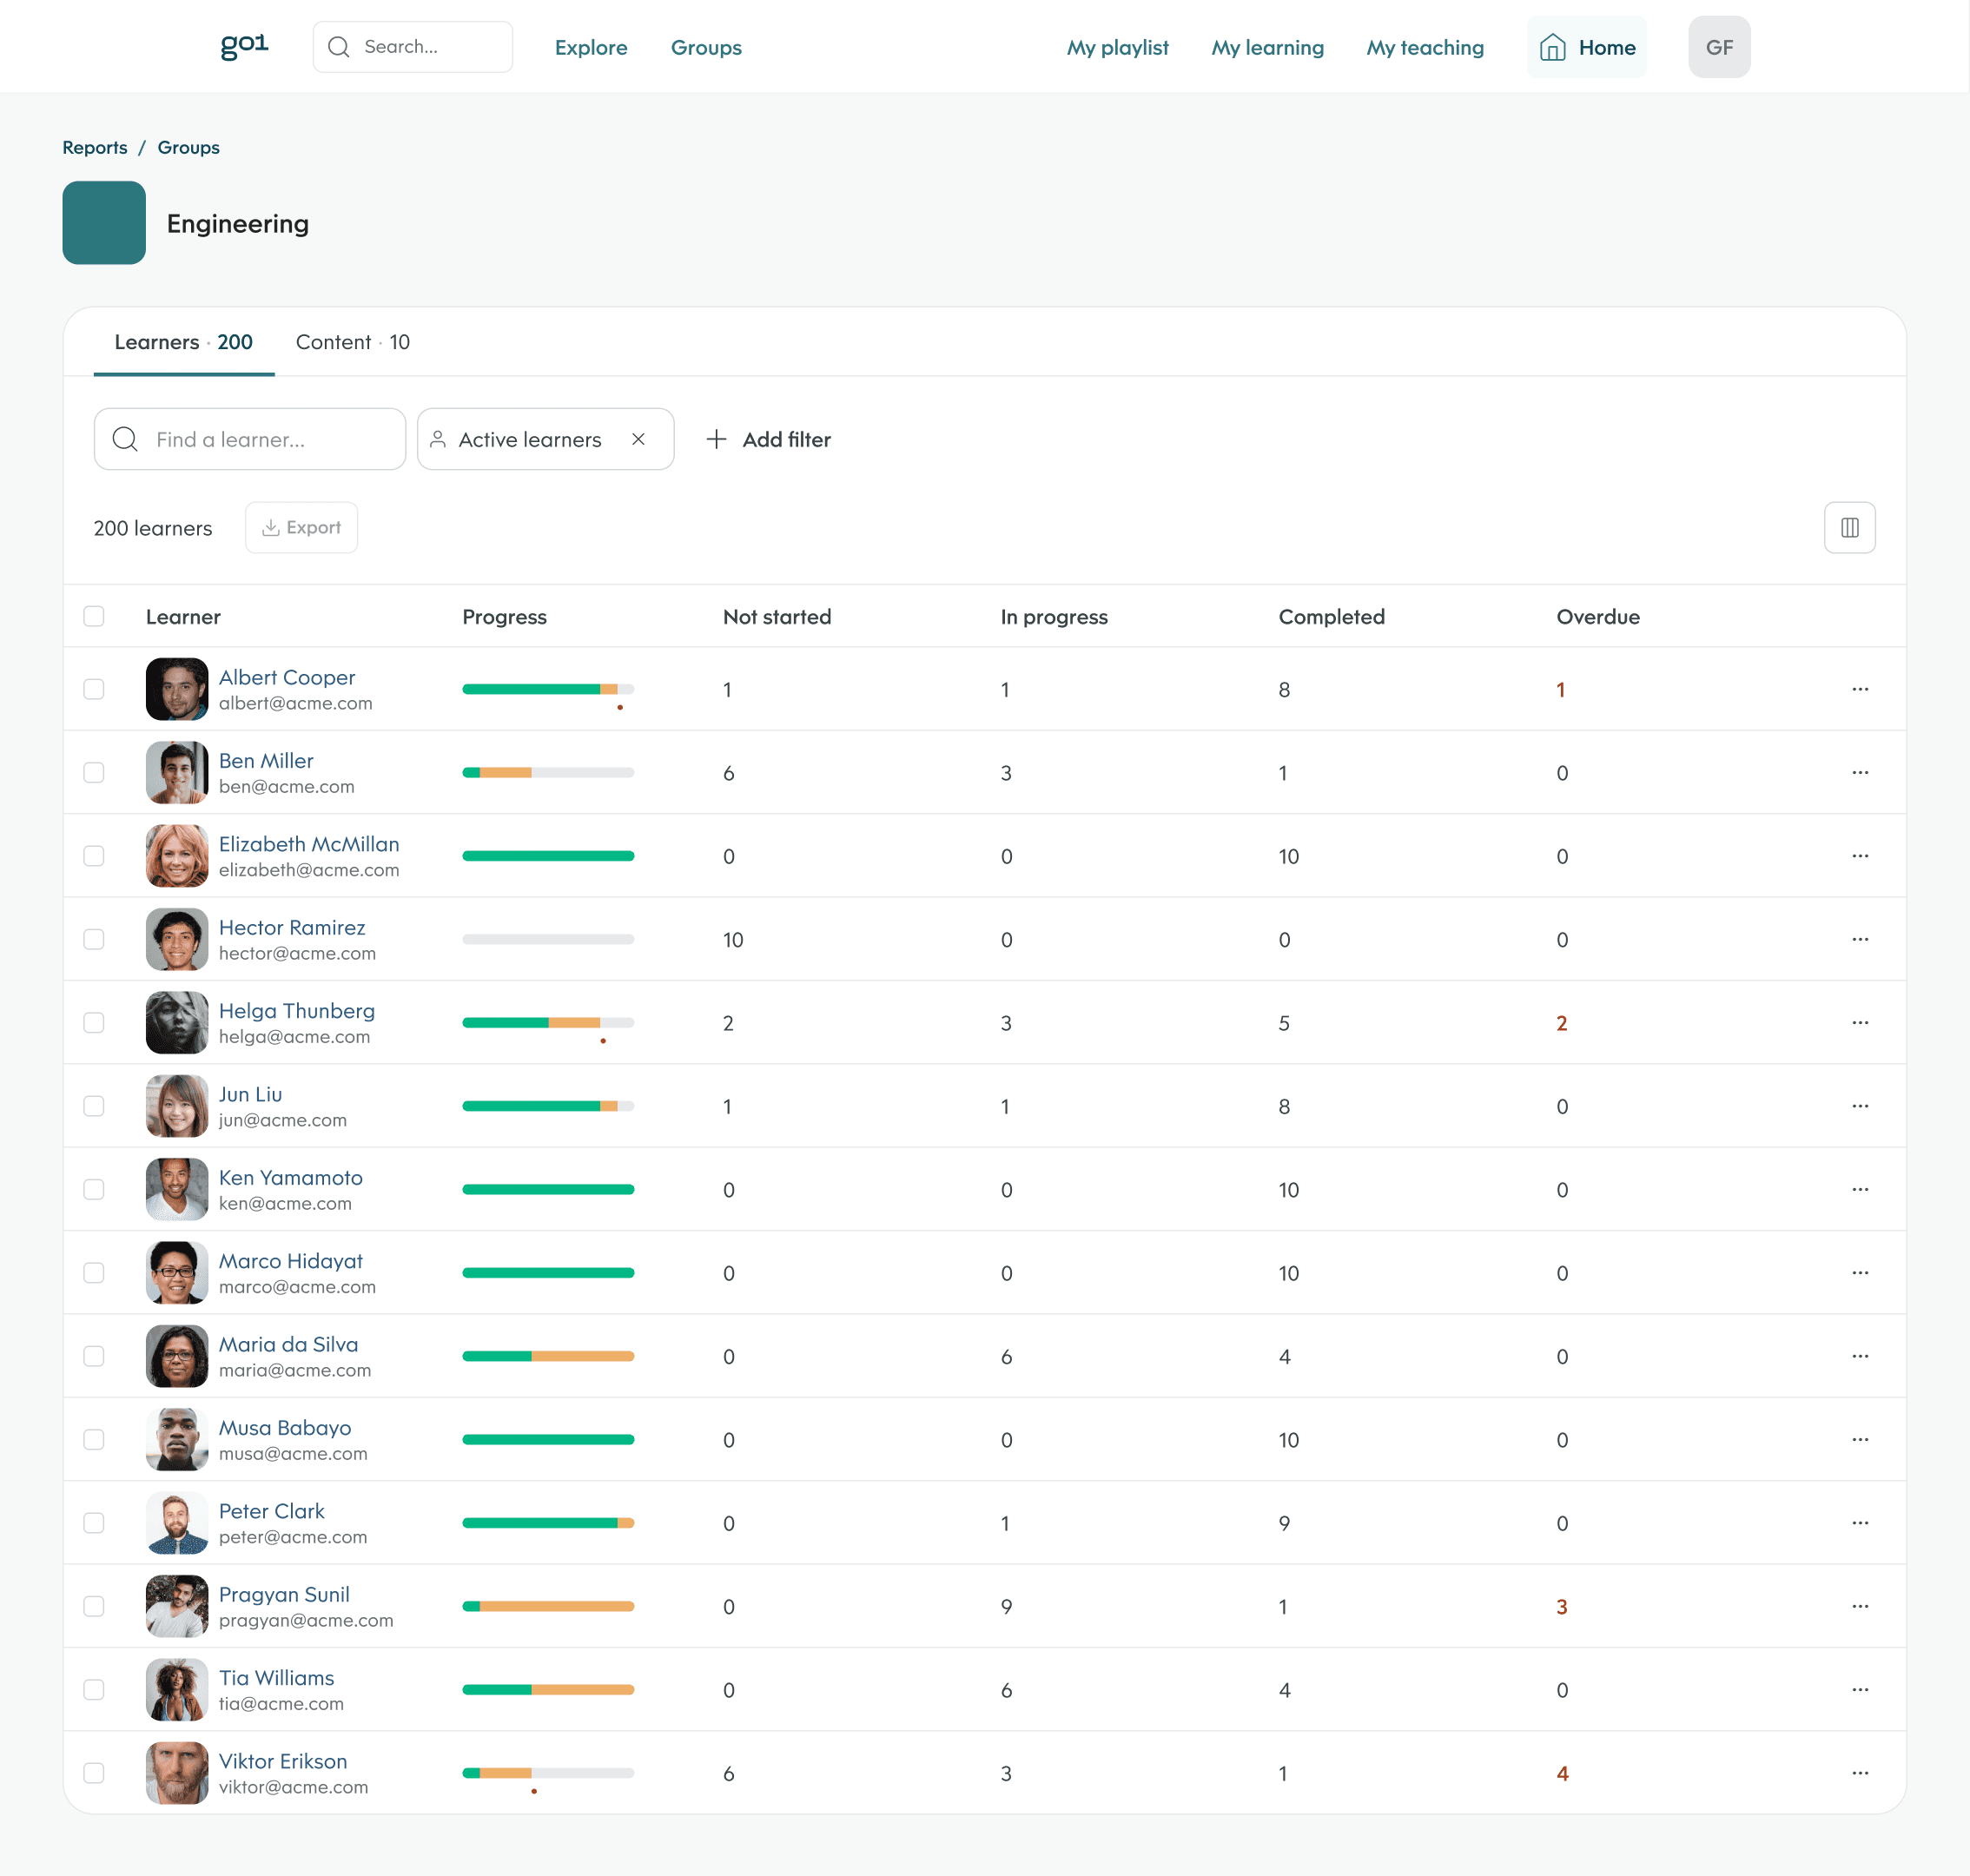
Some opportunities, like improving data accuracy, were solved through the technical solution. Our key design challenge was different: how to make complex, relational data understandable and manipulable for a non-technical audience. We addressed this by improving filtering capabilities and introducing out-of-the-box hierarchy, giving users an aggregate view of content, learners, and teams that they could progressively drill into, rather than presenting flat, raw data.
Wireframes
We first explored the solutions as wireframes, allowing us to quickly share them with our internal L&D team for feedback. This let us test the hierarchy concept early, validating whether a drill-down structure would actually reduce the burden on users compared to making them build their own aggregated views.
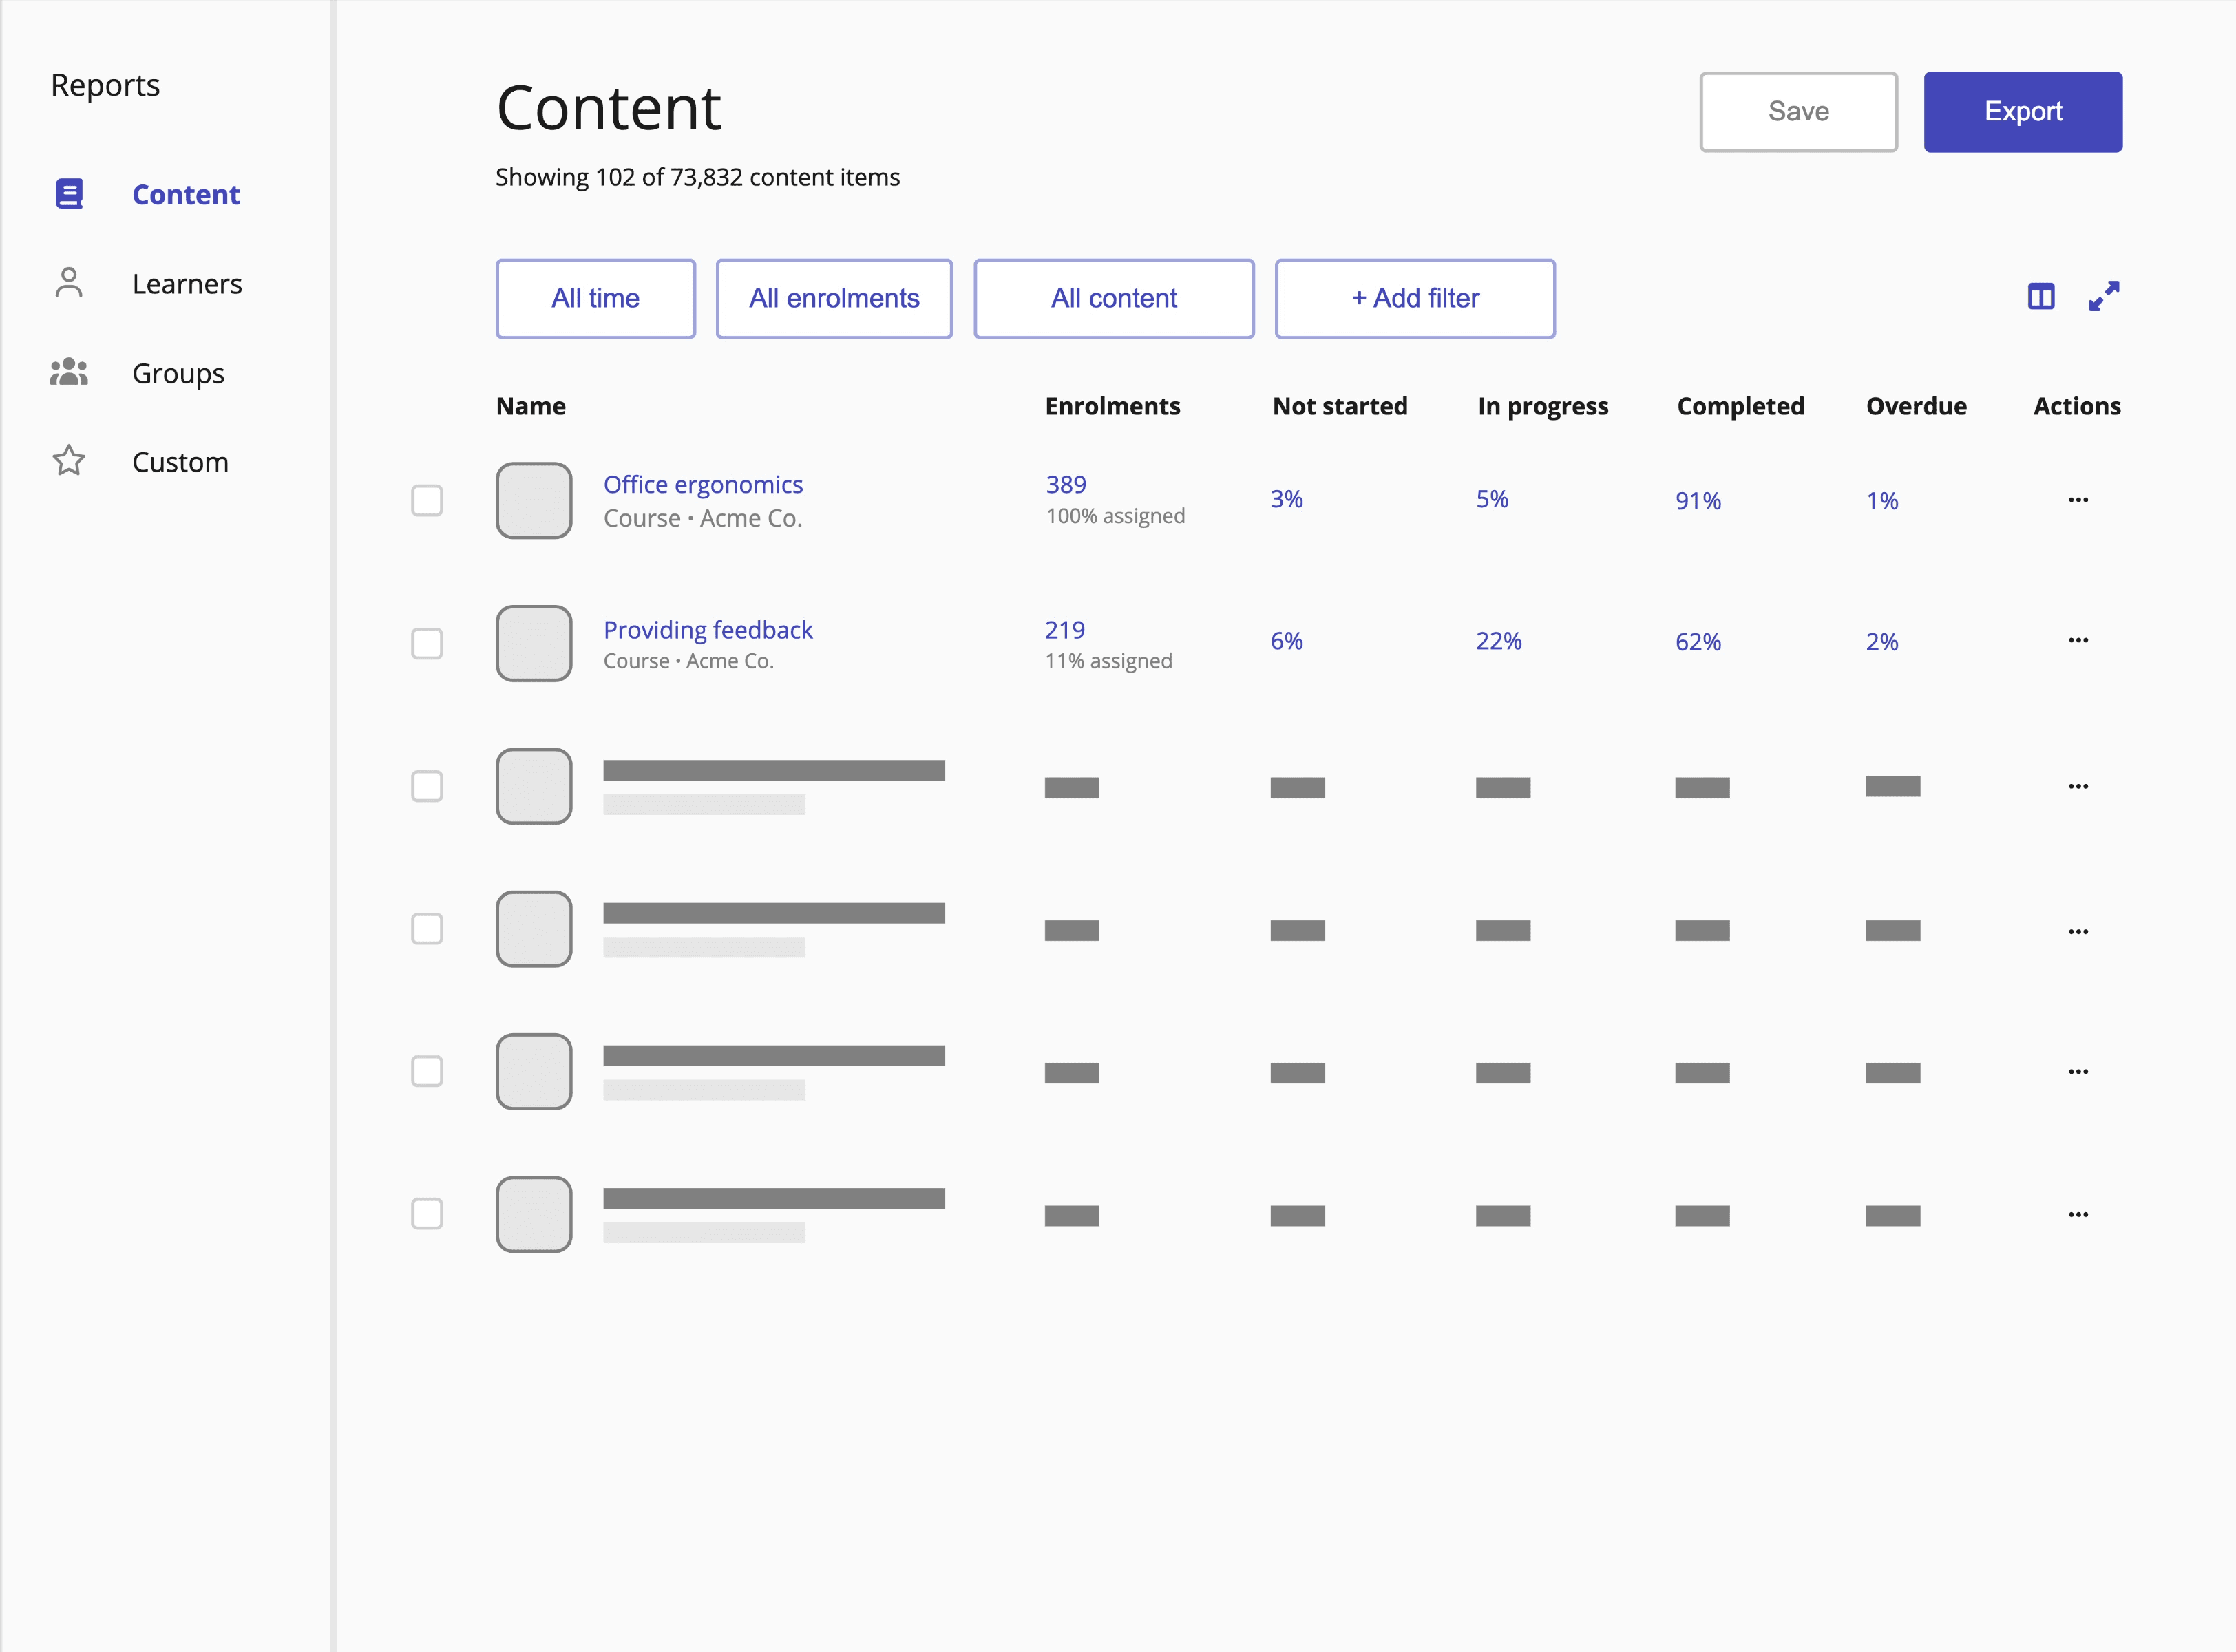
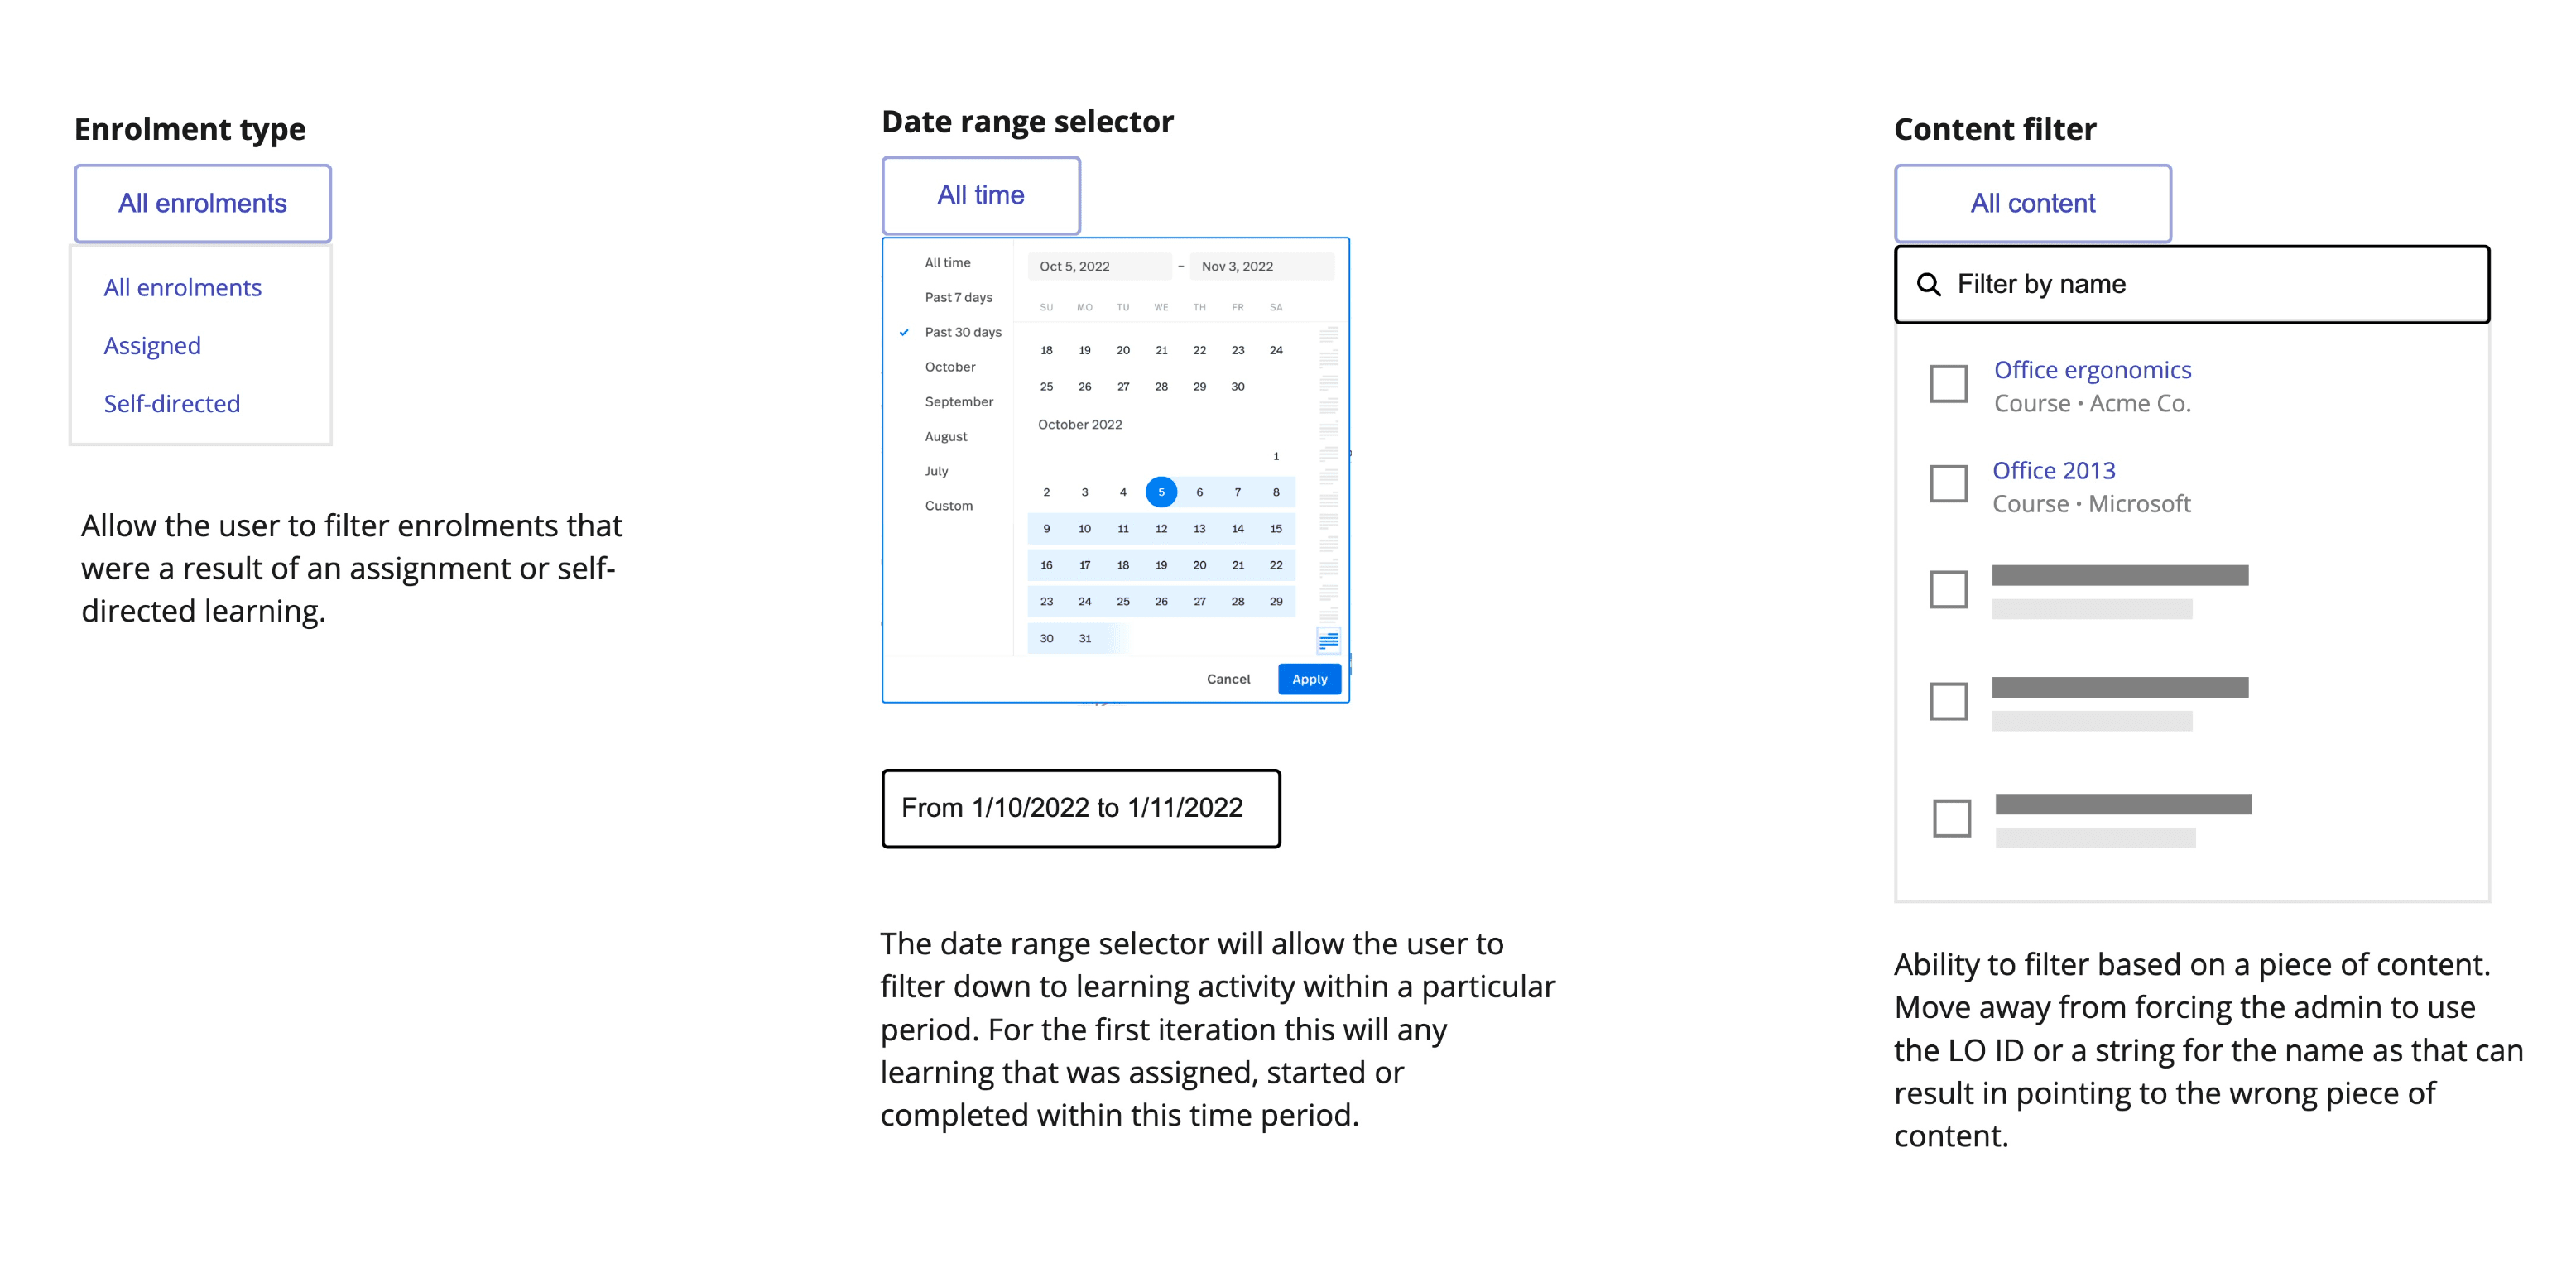
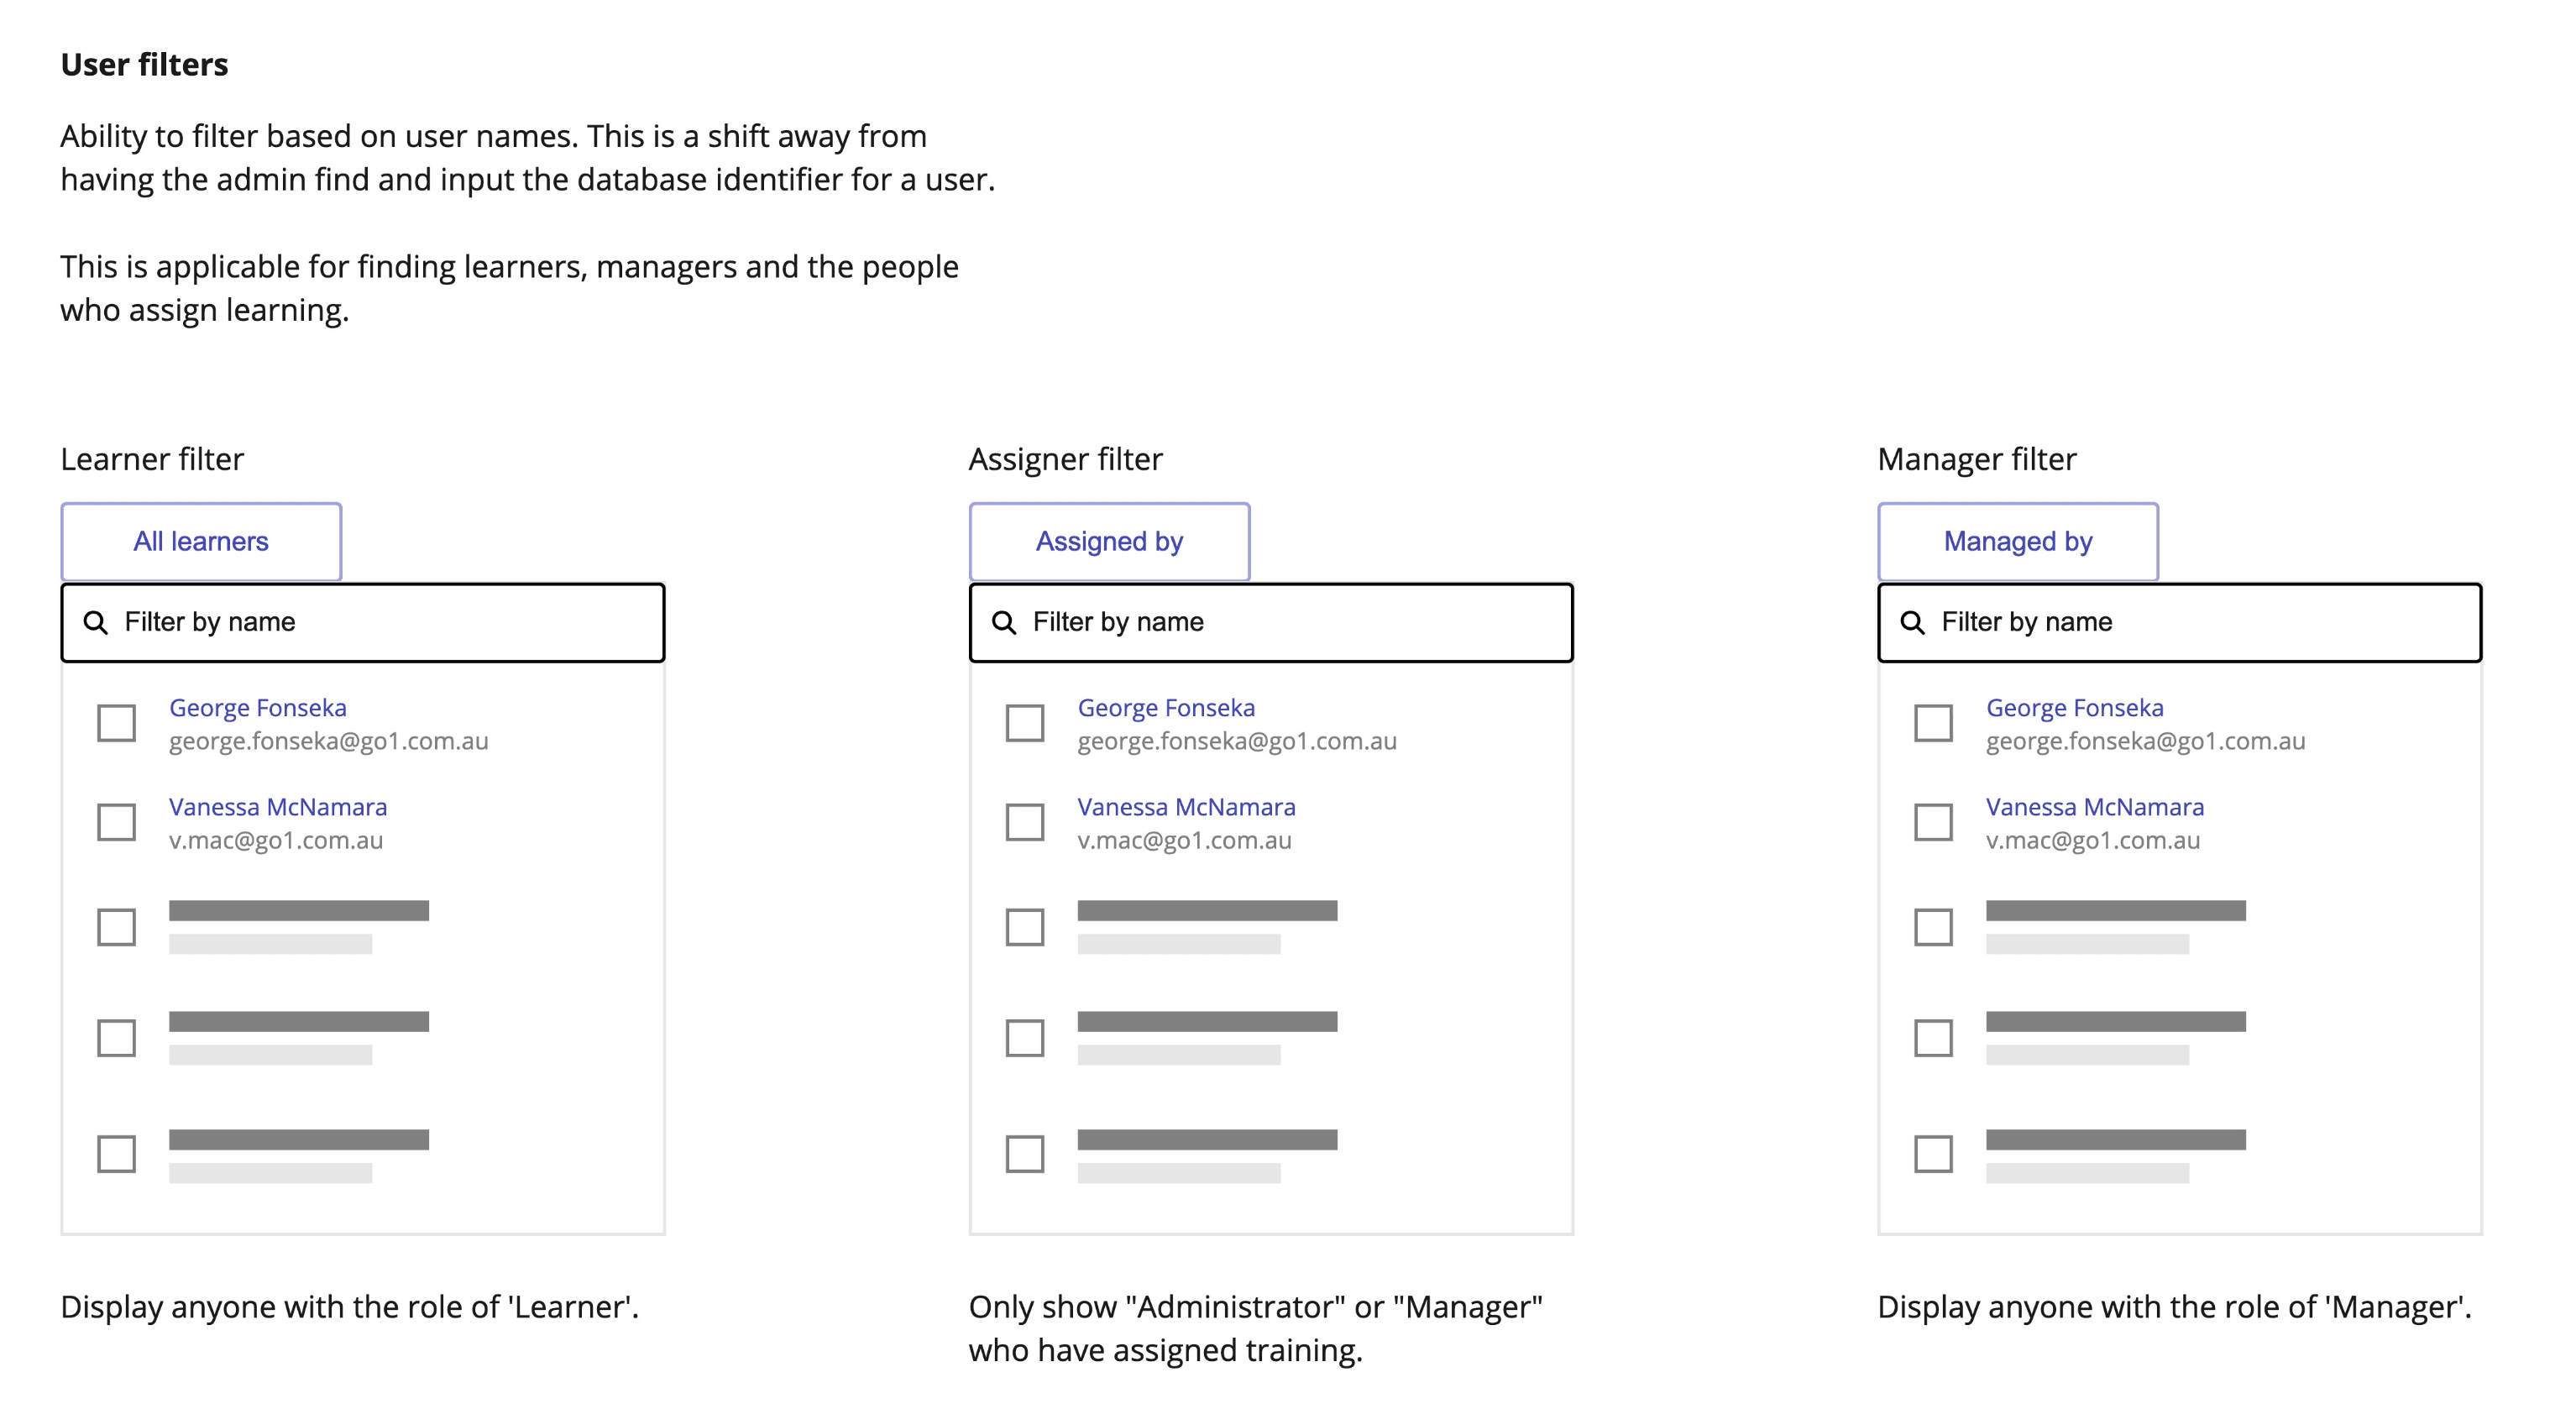
For filtering, we went back to basics, starting by removing database identifiers from the available filters. Instead of forcing users to find the ID of a piece of content, a user, or a group, we made it possible for them to select these directly from the interface. We then exposed filters that matched how users thought about their data, such as finding training they had assigned, or training assigned within a particular time period.
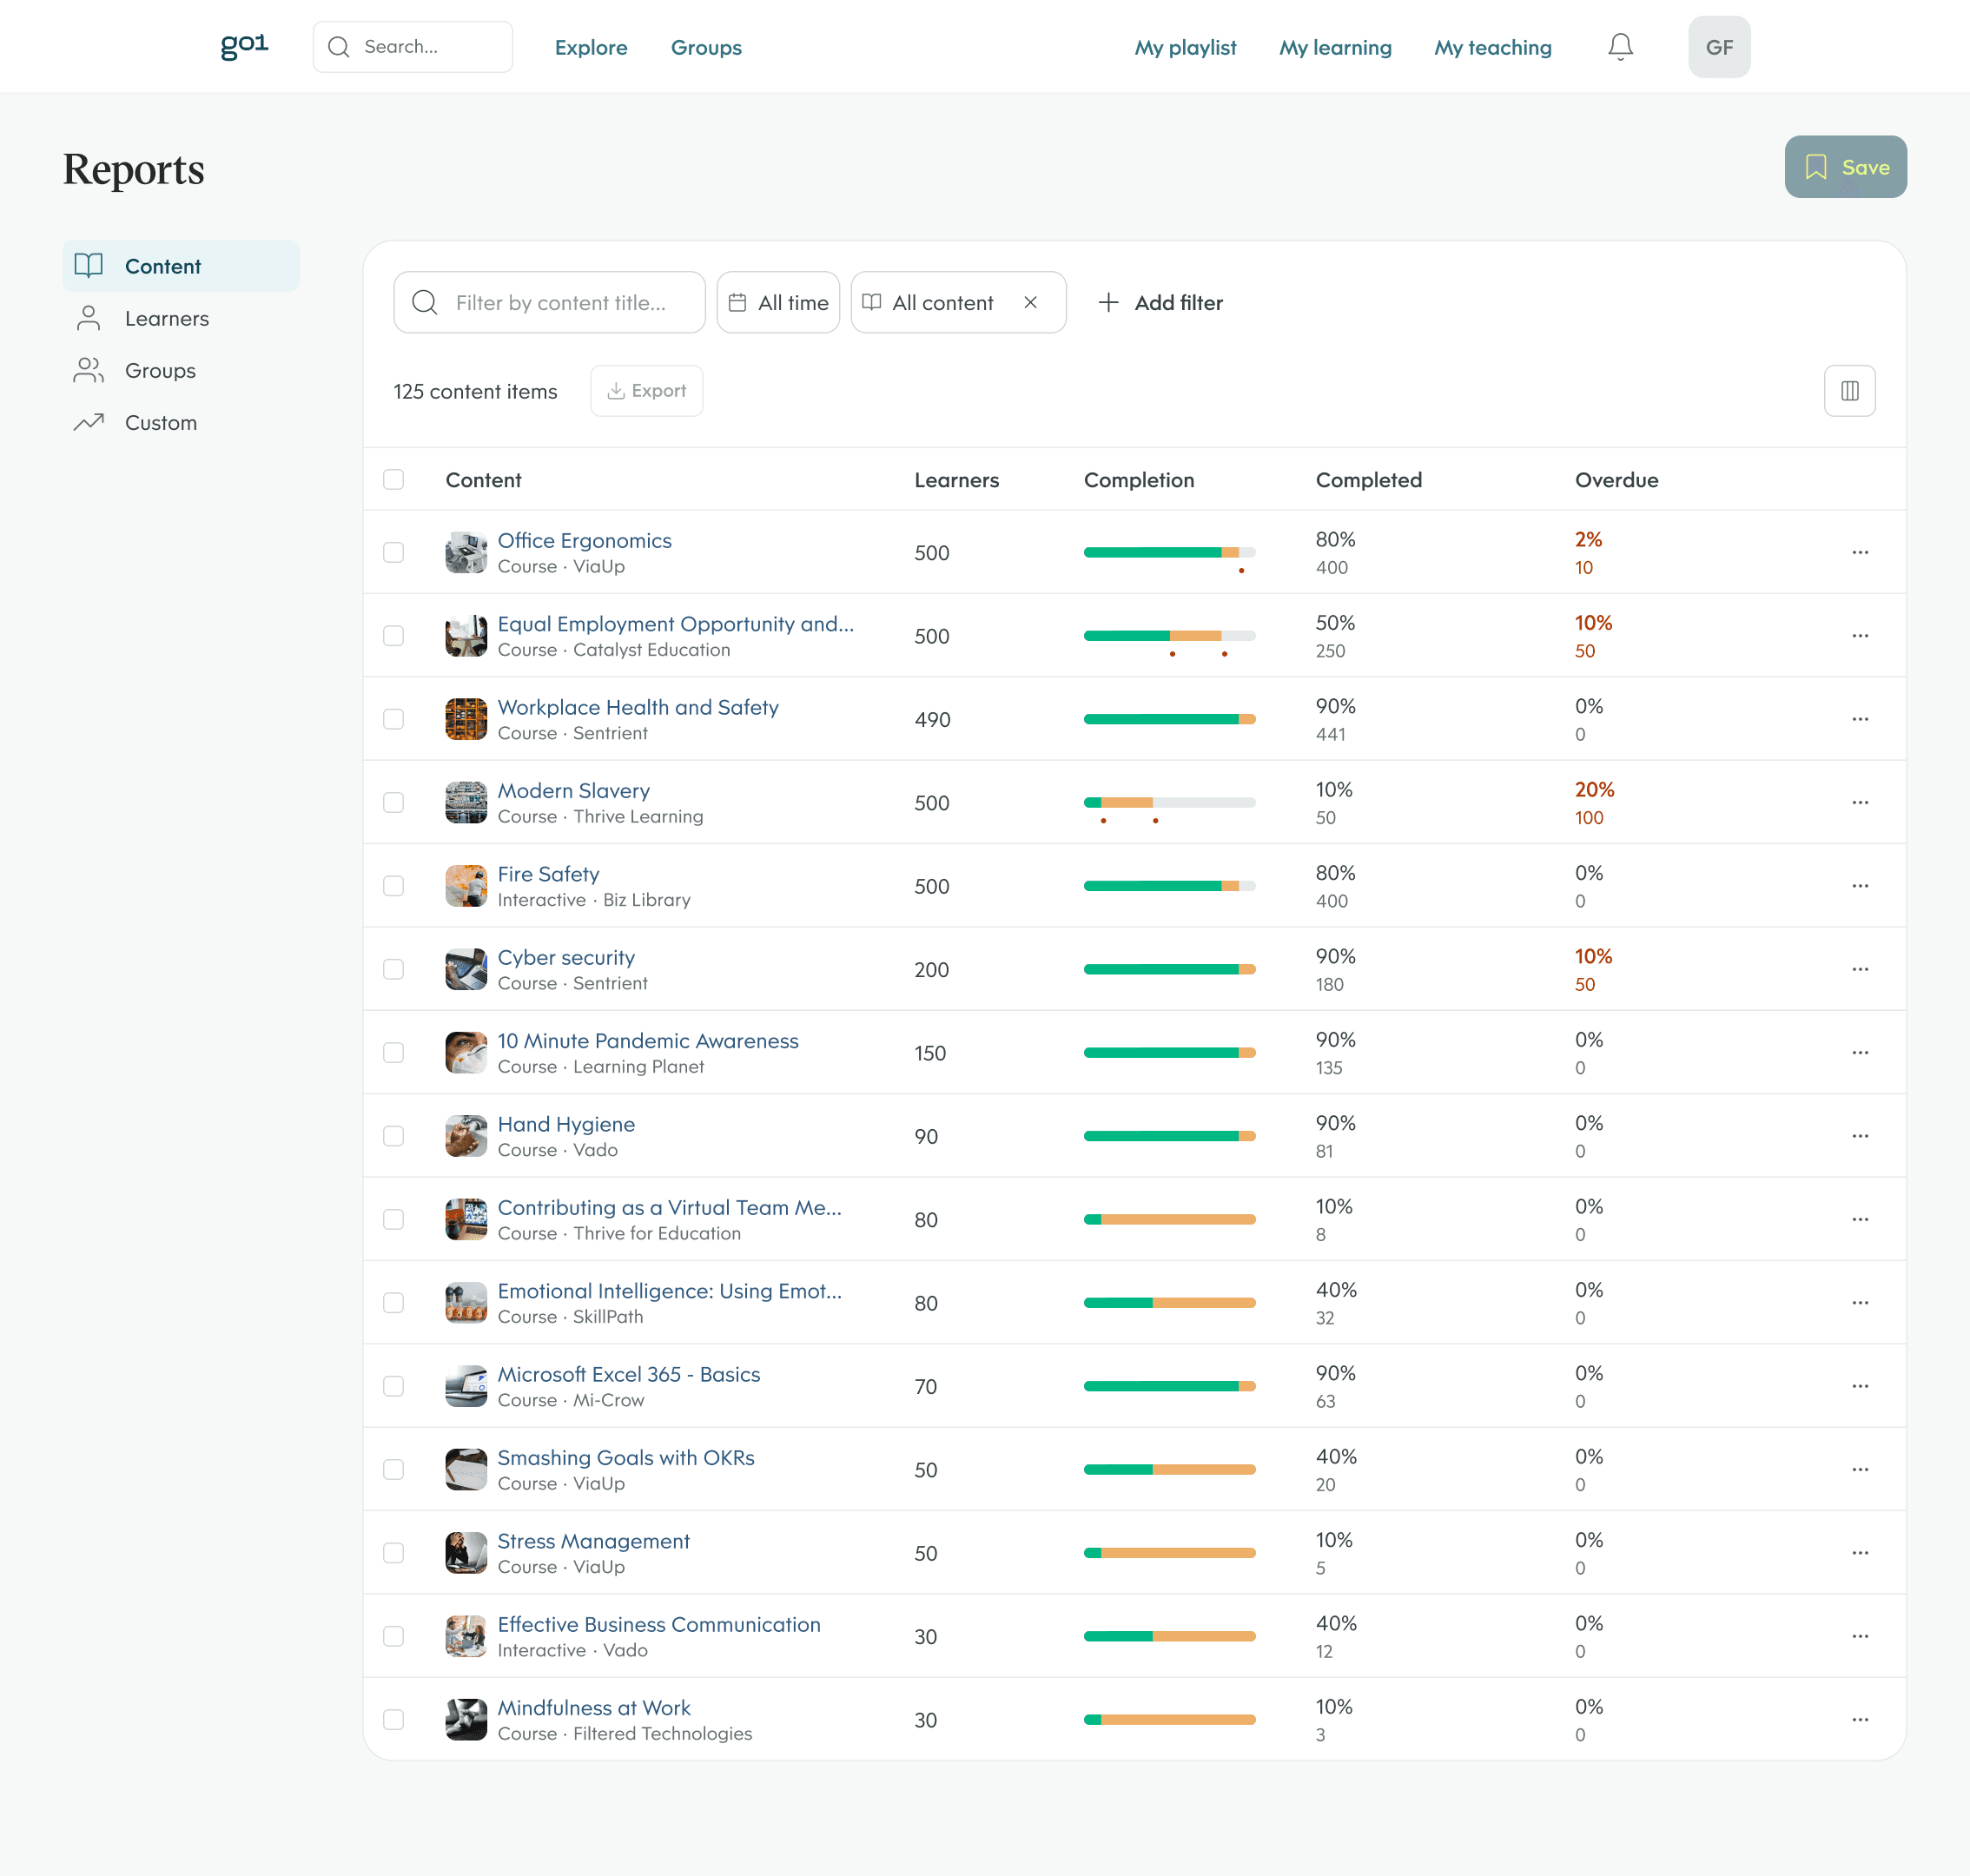
High-Fidelity Designs
Most components already existed in the Go1 design system, which meant progressing to high fidelity was relatively straightforward. The main effort went into the data visualisations and ensuring the prototype used realistic mock data. Small inaccuracies tend to distract expert participants during usability testing and undermine confidence in the results.
Usability Testing
We tested with five customers from organisations of varying sizes and industries. The focus was on whether the designs were discoverable, intuitive, and genuinely valuable to L&D managers in practice.
The results were strong. All participants were able to interpret the aggregate data and drill down to find the detail they needed without assistance. The hierarchy approach which had been the central bet of the design proved to be the right call.
Testing also surfaced useful directions for future iterations: proactive compliance alerts before a learner becomes overdue, clearer filter labels, and reporting views tailored for managers and team leads rather than just L&D admins.
One participant went further than the test itself. Shortly after the session, they reached out directly to their account manager:
“This is exactly what our schools are desperate for. It's perfect! … I thought I would reach out and see if there is anything you can do to throw some weight behind this to move it to the top of the list to be built.”
Participant 3
Outcome
Despite the validation, an untimely change in product strategy led to the initiative being deprioritised. In the following half-year, customer churn rose to levels not seen in years with reporting cited as one of the top reasons for leaving. The decision was eventually reversed to get customer churn under control.
The feature has recently been built, informed by the original research and design. Another designer has carried the work, with improved filtering and aggregated views, forward. Due to the technological advancements in AI, the design was taken a step further to allow the creation of custom reports with natural language.
What this project reinforced is that good research has a longer shelf life than the project it was created for. The customer interviews, opportunity solution tree and usability testing stayed relevant when the initiative was paused. It waited for when the business was ready, and when it was, the direction was already there.